. 2007 Feb;4(2):175-85.
doi: 10.1016/j.hrthm.2006.10.023. Epub 2006 Nov 1.

Mechanism of origin of conduction disturbances in aging human atrial bundles: experimental and model study

Affiliations

Mechanism of origin of conduction disturbances in aging human atrial bundles: experimental and model study

Madison S Spach et al. Heart Rhythm. 2007 Feb.

Abstract

Background: Aging is associated with a significant increase in atrial tachyarrhythmias, especially atrial fibrillation. A macroscopic repolarization gradient created artificially by a stimulus at one site before a premature stimulus from a second site is widely considered to be part of the experimental protocol necessary for the initiation of such arrhythmias in the laboratory. How such gradients occur naturally in aging atrial tissue is unknown.

Objective: The objective of this study was to determine if the pattern of cellular connectivity in aging human atrial bundles produces a mechanism for variable early premature responses.

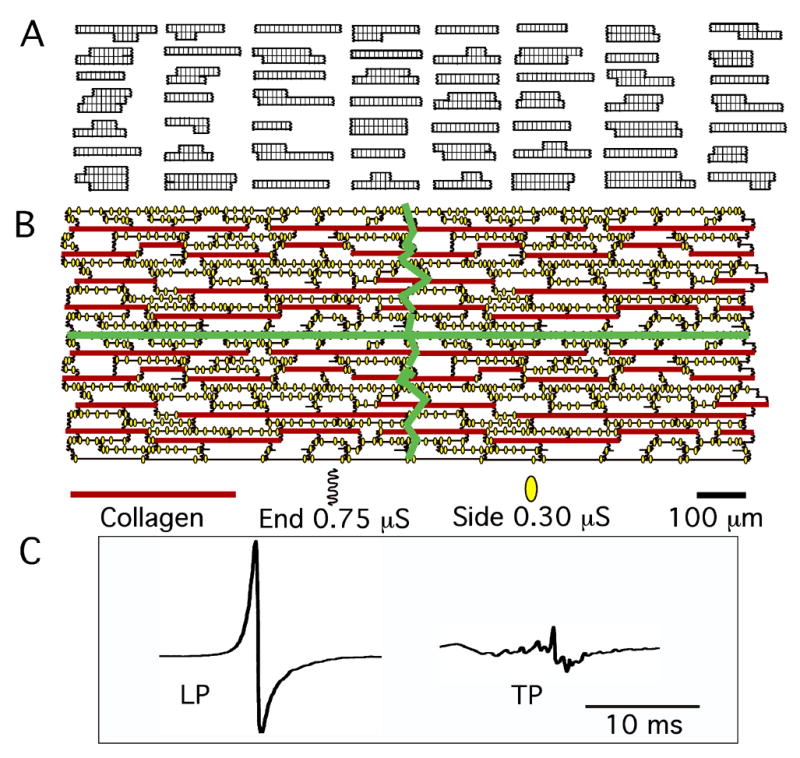
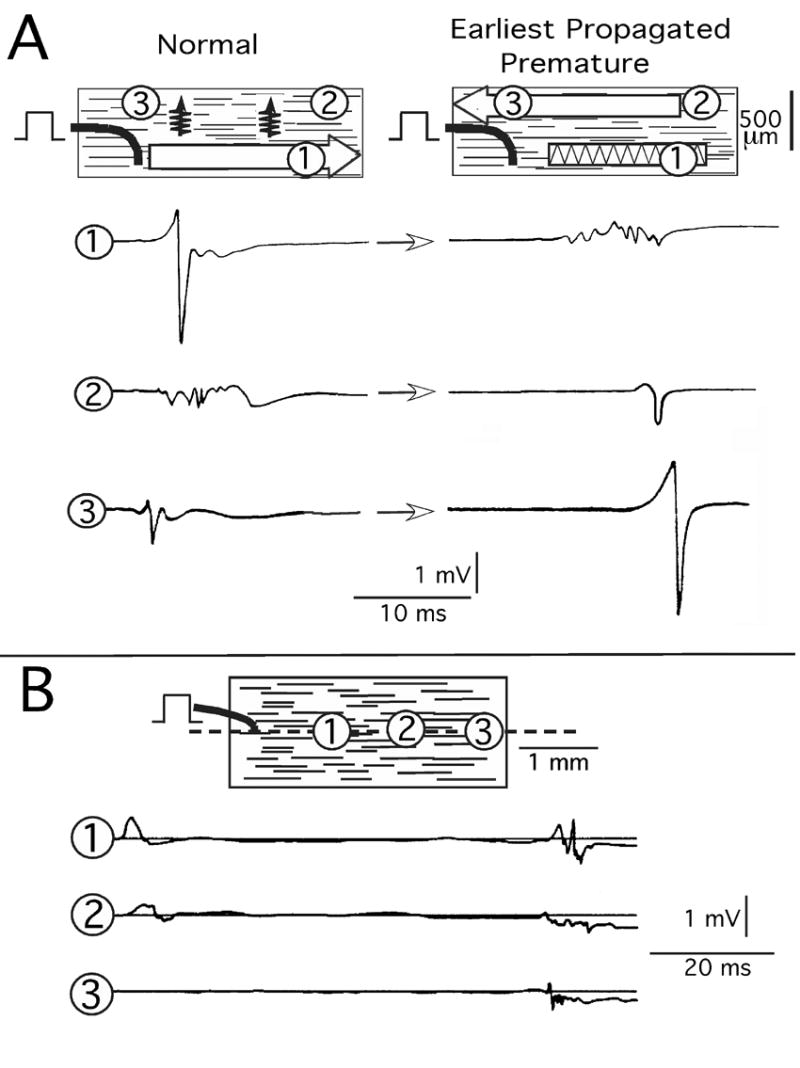
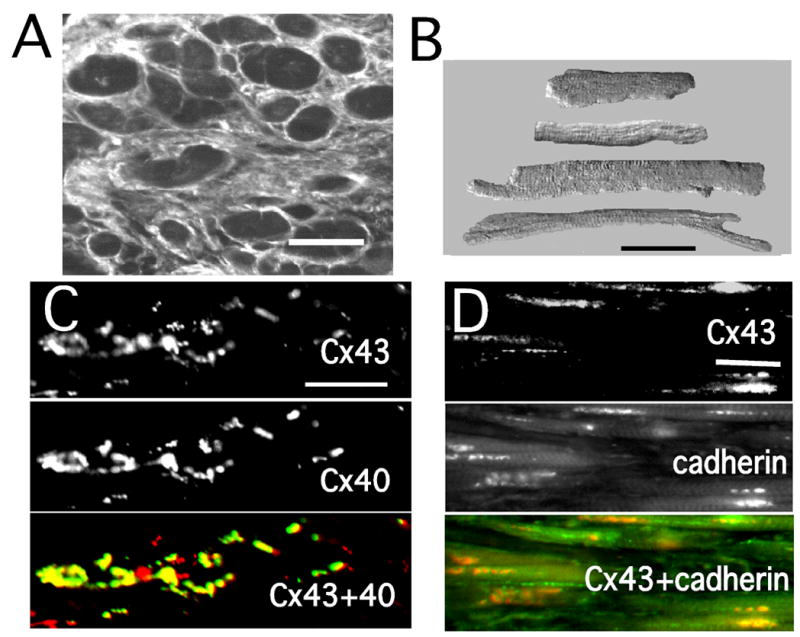
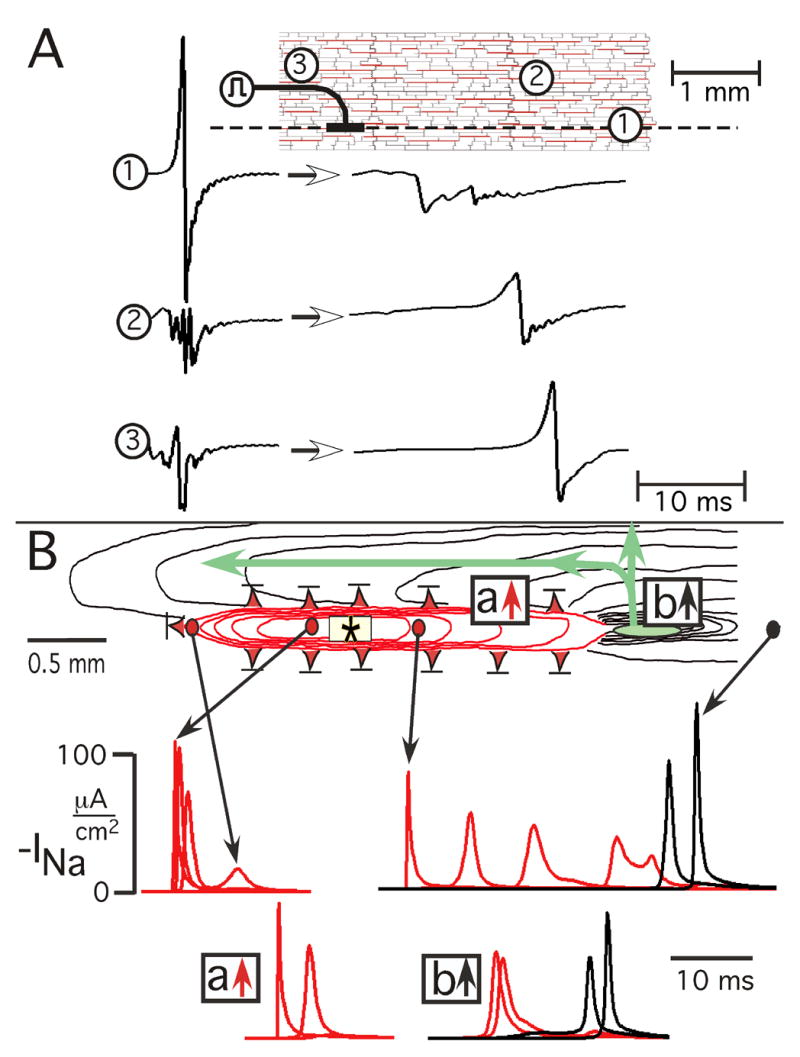
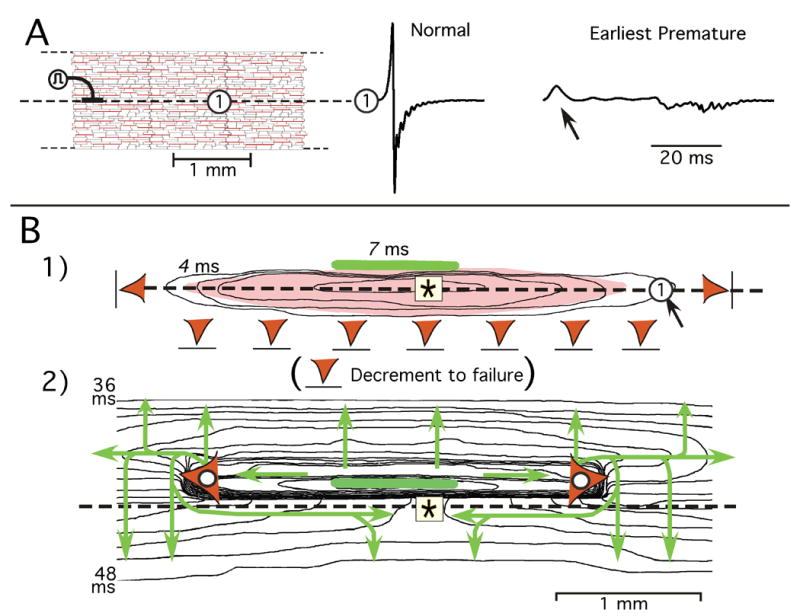
Methods: Extracellular and intracellular potentials were recorded after control and premature stimuli at a single site in aging human atrial bundles. We also measured cellular geometry, the distribution of connexins, and the distribution of collagenous septa. A model of the atrial bundles was constructed based on the morphological results. Action potential propagation and the sodium current were analyzed after premature stimuli in the model.

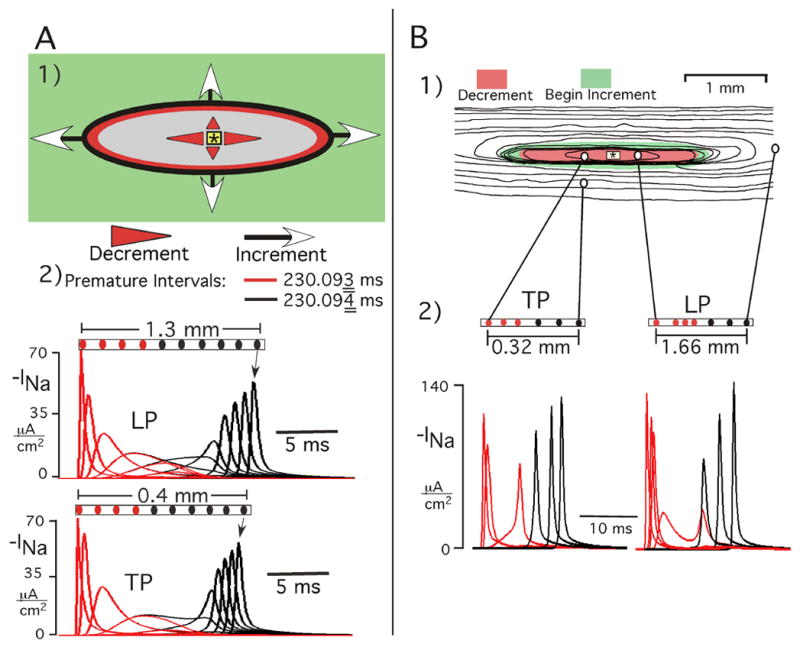
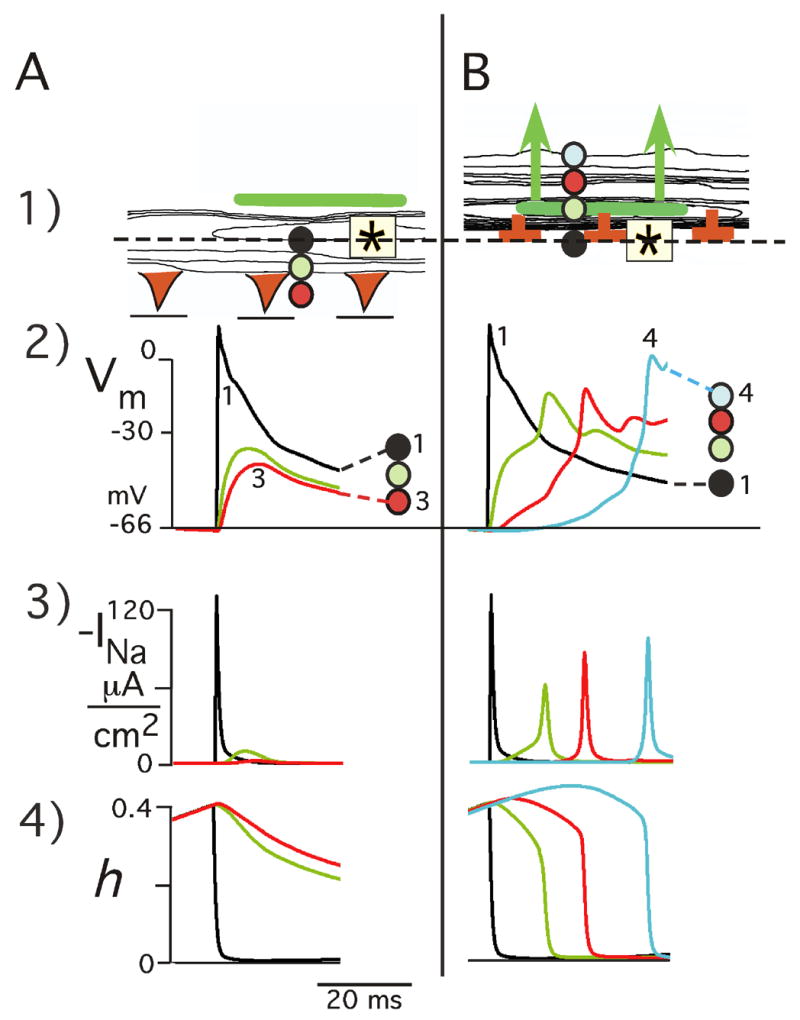
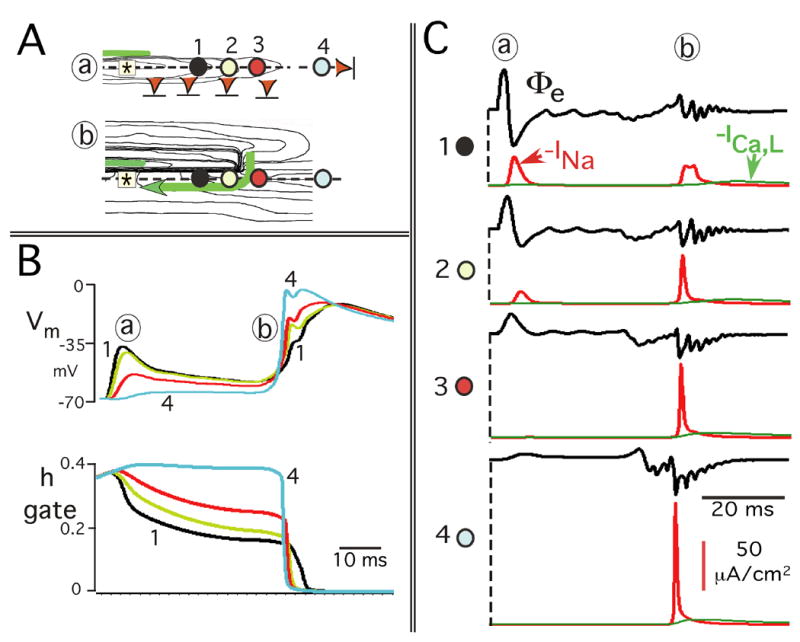
Results: Similar extracellular potential waveform responses occurred after early premature stimuli in the aging bundles and in the model. Variable premature conduction patterns were accounted for by the single model of aging atrial structure. A major feature of the model results was that the conduction events and the magnitude of the sodium current at multiple sites were very sensitive to small changes in the location and the timing of premature stimuli.

Conclusion: In aging human atrial bundles stimulated from only a single site, premature stimuli induce variable arrhythmogenic conduction responses. The generation of these responses is greatly enhanced by remodeling of cellular connectivity during aging. The results provide insight into sodium current structural interactions as a general mechanism of arrhythmogenic atrial responses to premature stimuli.


Figures

Figure 1
Figure 1
Atrial age microstructural model. A: 56 myocytes that formed a single unit of the model. B: Four units connected together. The green lines demarcate the four separate units. End and side gap junctions and their conductance values are shown, as well as the varying lengths of the collagen septa. C: Typical control longitudinal (LP) and transverse (TP) extracellular waveforms produced by model were quite similar to experimental Φe waveforms.
Figure 2
Figure 2
Experimental earliest premature propagation responses. A: Extracellular waveform (Φe) response with lateral shift of longitudinal propagation. B: Reentry response. Encircled numbers indicate sites of Φe waveform recordings. The premature interval in A was 215 ms, and in B it was 228 ms.
Figure 3
Figure 3
Representative experimental morphological results. A: Cross section of 72 year-old bundle. B: Isolated atrial myocytes of variable size and shape. C: Single and double labeling of connexin 43 (Cx43) and connexin40 (Cx40). D: Single and double labeling of Cx43 and cadherins (pan-cadherin antibody). All bars = 50 μm.
Figure 4
Figure 4
Decremental-incremental propagation (conduction gating) as a fundamental process initiated by early premature stimuli. A: Earliest successful premature response in a hypothetical continuous anisotropic sheet. Panel A1 shows a map that spatially represents INa events. Red and gray areas represent decremental conduction, and increment occurred in the green area. Panel A2 shows INa curves at sites progressively distal to stimulus (red = decrement, black = increment). Reduction of premature interval by 1 μs produced failure at the oval line. The INa curves for both premature intervals (red = 230.093 ms, black = 230.094 ms) are superimposed to illustrate the marked similarity of the decremental phase inside the black oval for both the successful and the failed response. For purposes of the graphs, negative INa is plotted. B: Spatial effects on INa of reducing the premature interval in atrial age model. Panels B1 and B2 show the excitation sequence with TP and LP INa curves following a premature stimulus interval that was 2 ms longer than refractory period. In the isochrone map, the isochrones are 3 ms apart, the red zone represents region of initial decrement of peak INa, and the green area is the surrounding zone in which increment began. The TP and LP INa curves in panel B2 are at the locations connected to the map in panel B1; red curves are decremental, black curves are incremental.
Figure 5
Figure 5
Lateral shift of longitudinal conduction produced by earliest successful response in atrial age model. A: Unipolar extracellular waveforms. Encircled numbers on model grid identify location of extracellular waveforms, and the dashed line is longitudinal axis of stimulus (symbol). Arrows between waveforms indicate change from control (left) to earliest premature successful response (right). B: Underlying pattern of excitation spread and associated sodium current events. Red isochrones represent decremental conduction, black isochrones represent incremental or stable propagation. Isochrones are 3 ms apart. Red triangles with bars indicate locations of failure of decremental conduction. Small green oval denotes location of initiation of incremental conduction. The time course of INa is shown below: the locations of the INa curves during initial LP are represented by arrows from circles. The locations of the INa curves of initial transverse conduction are identified by boxes in which red arrow denotes decrement to failure and black arrow denotes decrement followed by increment (a conduction gate). The events shown occurred at a premature stimulus interval of 222.639 ms, and conduction failed at a stimulus interval of 222.638 ms (refractory period).
Figure 6
Figure 6
Reentry produced by earliest successful response in atrial age model. A: Representative premature extracellular waveform change along longitudinal axis of the stimulus. B: Underlying excitation sequence depicted in two sequential isochrone maps. Isochrones are separated by 2 ms. Panel B1 shows initial decremental conduction in all directions with failure (red triangles) in both longitudinal directions and in the inferior direction of transverse decrement. The elongated light-red area superimposed on isochrones represents region of INa turn-on during decrement; arrow pointing to the circle marks location of the Φe waveform in panel A. Green horizontal bar represents small area in which incremental propagation began. Panel B2 is an isochrone map of excitation spread from the area of initial incremental conduction. Each of the red triangles with white circles mark the location at which longitudinal conduction failed after being initiated in the area of the green bar. The green arrows show the direction of isochrone movement in each area. The events shown occurred at a premature stimulus interval of 231.113 ms; conduction failed at a stimulus interval of 231.112 ms (refractory period).
Figure 7
Figure 7
Structural loading effects on Vm and INa as mechanism of initial TP decrement followed by failure versus incremental successful propagation in reentry response. A: Initial TP decrement to failure inferiorly. Panel A1 shows an early part of the excitation sequence of Figure 6B1. Vm, INa, and the state of the sodium channel inactivation gate h are shown at 3 sties 50 μm apart in area beneath the zone of initial incremental conduction (green bar). B: Initial TP incremental conduction superiorly. The top of panel B1 shows the initial part of the excitation sequence of Figure 6B2. The associated time course of Vm, INa, and h is shown below for positions 1–4. The colored circles identify the Vm, INa, and h tracings with rspect to their locations 50 μm apart.
Figure 8
Figure 8
Reentrant mechanisms involving the transmembrane potential effects on h inactivation and INa along longitudinal axis of stimulus. A: Four observation sites are superimposed on parts of the isochrone maps of Figure 6B: (a) initial decremental conduction to failure; (b) longitudinal reentrant excitation. The observations sites are the same in (a) and (b). B: Relationship of the time course of Vm and the sodium h gate at each of the 4 sites in Panel A. C: Time course of INa in relation to the extracellular potential waveforms (Φe) at each observation site. The time course of the L–Type Ca2+ current, ICa,L (green curve), is also shown for each observation site in Panel C to illustrate the relatively small magnitude of ICa,L generated by the earliest propagated premature responses.

Comment in

References

    1. Spach MS, Dolber PC, Heidlage JF. Influence of the passive anisotropic properties on directional differences in propagation following modification of the sodium conductance in human atrial muscle. A model of reentry based on anisotropic discontinuous propagation. Circ Res. 1988;62:811–832. - PubMed
    1. Chen P-S, Wolf PD, Dixon EG, Danieley ND, Frazier DW, Smith WM, Ideker R. Mechanism of ventricular vulnerability to single premature stimuli in open-chest dogs. Circ Res. 1988;62:1191–1209. - PubMed
    1. Gotoh M, Uchida T, Mandel WJ, Fishbein MC, Chen P-S, Karagueuzian HS. Cellular graded responses and ventricular vulnerability to reentry by a premature stimulus in isolated canine ventricle. Circulation. 1997;95:2141–2154. - PubMed
    1. Karagueuzian HS, Chen P-S. Cellular mechanism of reentry induced by a strong electrical stimulus: Implications for fibrillation and defibrillation. Cardiovasc Res. 2001;50:251–262. - PubMed
    1. Antzelevitch C, Fish J. Electrical heterogeneity within the ventricular wall. Basic Res Cardiol. 2001;96:517–527. - PubMed

Publication types

MeSH terms