. 2007 Feb;12(2):221-34.
doi: 10.1016/j.devcel.2006.12.003.

BIM regulates apoptosis during mammary ductal morphogenesis, and its absence reveals alternative cell death mechanisms

Affiliations

BIM regulates apoptosis during mammary ductal morphogenesis, and its absence reveals alternative cell death mechanisms

Arnaud A Mailleux et al. Dev Cell. 2007 Feb.

Abstract

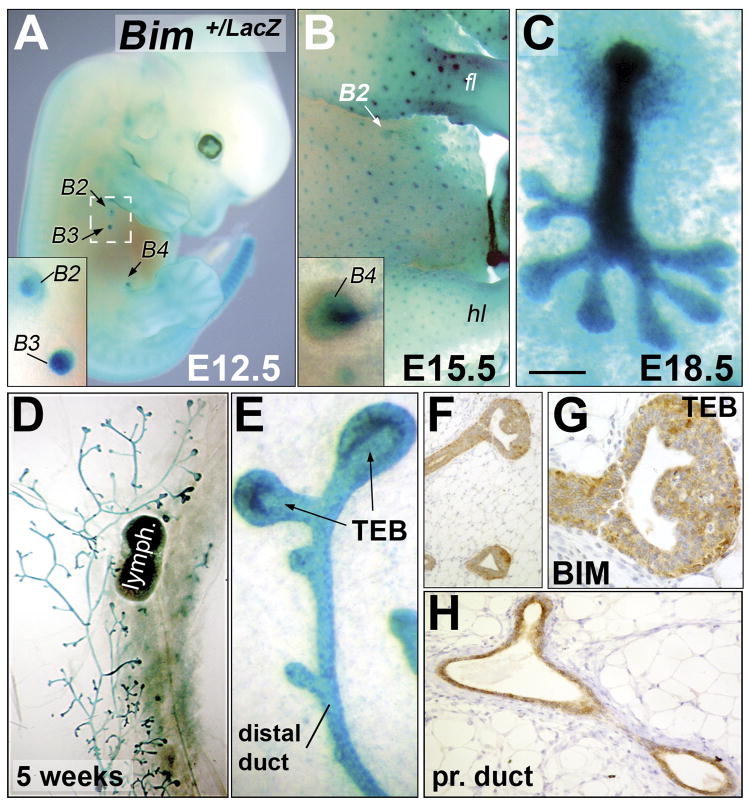
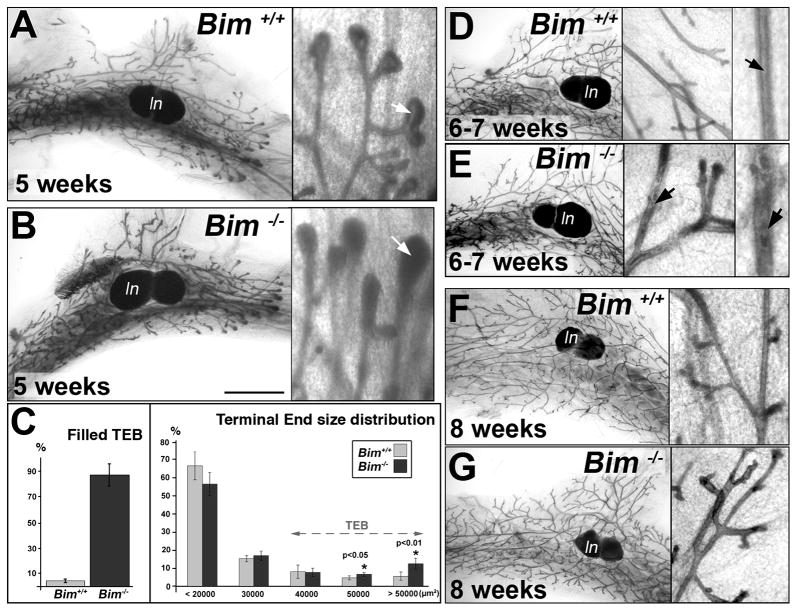
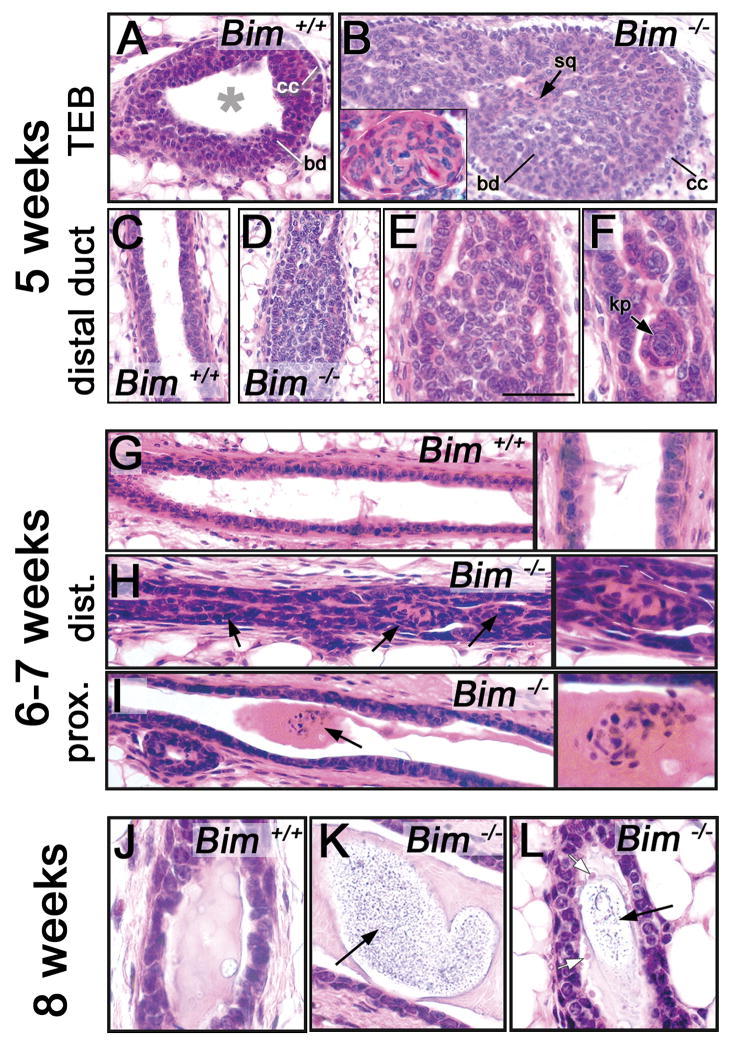
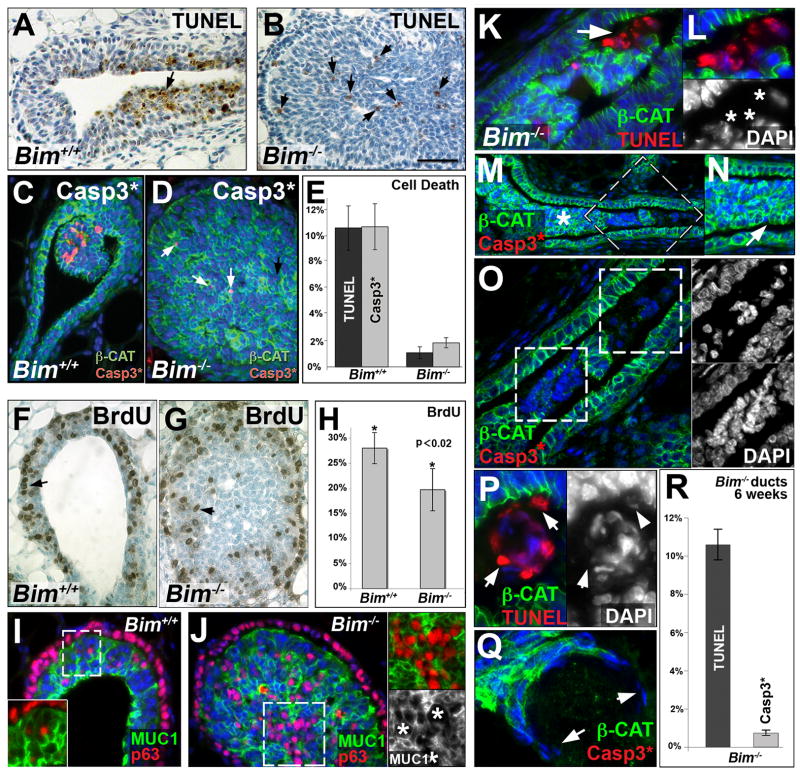
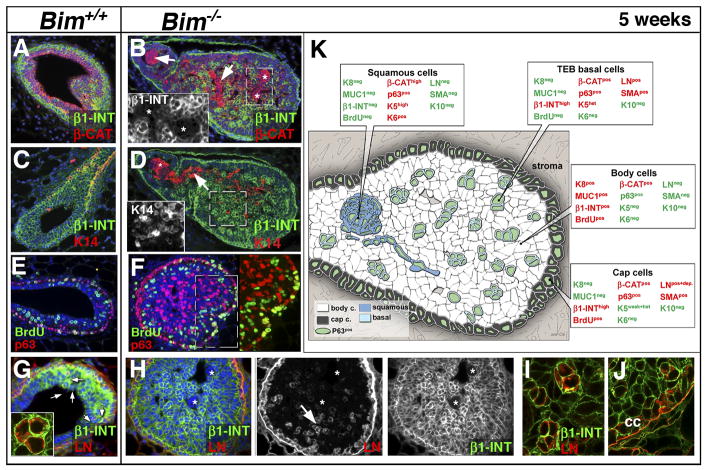
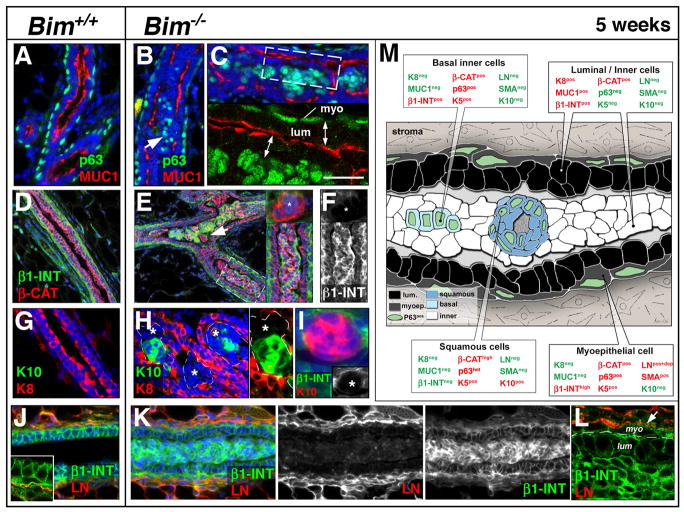
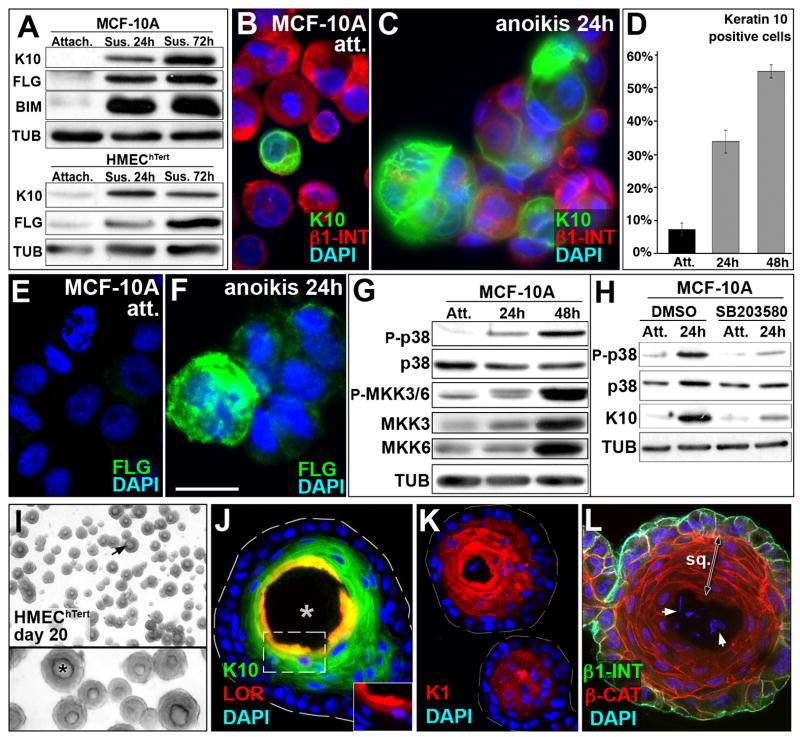
The adult, virgin mammary gland is a highly organized tree-like structure formed by ducts with hollowed lumen. Although lumen formation during pubertal development appears to involve apoptosis, the molecular mechanisms that regulate this process are not known. Here, we demonstrate that disruption of the BH3-only proapoptotic factor Bim in mice prevents induction of apoptosis in and clearing of the lumen in terminal end buds during puberty. However, cells that fill the presumptive luminal space are eventually cleared from the adjacent ducts by a caspase-independent death process. Within the filled Bim(-/-) ducts, epithelial cells are deprived of matrix attachment and undergo squamous differentiation prior to clearing. Similarly, we also detect squamous differentiation in vitro when immortalized mammary epithelial cells are detached from the matrix. These data provide important mechanistic information on the processes involved in sculpting the mammary gland and demonstrate that BIM is a critical regulator of apoptosis in vivo.


Figures

Figure 1
Figure 1. Bim expression in the developing mouse mammary gland
(A) X-gal stained E12.5 heterozygous Bim+/LacZ embryo. The insert shows a high magnification of the second and third pair of mammary buds. (B) X-gal stained E15.5 Bim+/− female embryo. Bim is expressed in the mammary and hair follicle buds. The insert shows a high magnification of a mammary bud (fourth pair). (C) X-Gal stained E18.5 Bim+/− female skin explant showing Bim expression in the mammary gland. (D) X-Gal staining of Bim+/− mammary gland at five weeks. (E) High magnification of a TEB and distal duct shown in D. (F–H) BIM immunostaining (Epitomics antibody #1036-1) of a TEB (F–G) and proximal duct (H) at five weeks. (G) High magnification of a TEB shown in F. [Scale bar: 1100 (A), 700 (B), 200 (A and B inserts, D), 100 (C), 20 (E,H), 25 (F), 12 (G) μm] Abbreviation: fl (forelimb), hl (hindlimb), B# (mammary bud), lymph. (lymph node), TEB (terminal end bud), pr. (proximal).
Figure 2
Figure 2. Comparison of whole mount Bim−/− and control mammary glands during puberty
(A–B) Whole mount staining of mammary glands from five week-old Bim+/+ (A) and Bim−/− (B) mice at low (left panel) and high (right panel) magnification. The luminal space is filled (white arrow) in the Bim −/− TEB (B, right panel). (C) Morphometric study of Bim−/− TEB at five weeks. Left panel: percentage of TEB without any detectable luminal space in Bim+/+ (4.4 % ± 1.3; n=7) and Bim−/− (86.6 % ± 9.3; n=8) mammary glands at five weeks. Right panel: size distribution (μm2) of terminal ends of the ducts in Bim+/+ (n=4) and Bim−/− (n=4) mammary glands at five weeks. The size distribution of terminal ends in the Bim+/+ and Bim−/− glands is: 66.7%± 7.8 (+/+) and 56.6% ± 6.3 (−/−) for sizes below 20000 μm2, 15.2% ± 1.7 (+/+) and 16.9% ± 2.6 (−/−) between 20000 and 30000 μm2, 8% ± 3.7 (+/+) and 7.6% ± 2.3 (−/−) from 30000 to 40000 μm2; 4.6% ± 1.1 (+/+) and 6.5% ± 1 (+/+) between 40000 and 50000 μm2 (paired t-test with p<0.05); 5.5% ± 2.3 (+/+) and 12.4% ± 3 (−/−) for TEBs above 50000 μm2 (paired t-test with p<0.01) (D–E) Whole mount staining of mammary glands from 6 to 7 week-old wild type (D) and Bim−/− mice (E) at low and high magnification. Note that the luminal space is clearing (black arrow) in E. (F–G) Whole mount staining of eight week-old wild type control (F) and Bim−/− (G) mammary glands at low and high magnification. [Scale bar: 300 (A-B-D-E), 450 (D–E), 550 (F–G), 60 (A-B-D-E-F-G insert), 30 (D–E right inserts) μm]. Abbreviation: TEB (terminal end bud), ln (lymph node).
Figure 3
Figure 3. Histology of Bim−/− and control mammary glands from five to eight weeks
(A–B) Sections of a wild type hollowed TEB (A) and a filled Bim−/− TEB (B) at five weeks. (B) The insert in B shows a high magnification of a squamous cell cluster. (C–F) Sections of a wild type hollowed control mammary duct (C) and filled Bim−/− duct (D–F) at five weeks. (E) High magnification of the filled lumen shown in D. (F) High magnification of a scattered keratin pearl (black arrow) in a Bim−/− filled duct. (G) Section of a wild type hollowed mammary duct at six to seven weeks. Right panel: high magnification of G. (H) Section of a Bim−/− filled distal mammary duct at six to seven weeks. Note the cells filling the luminal space (black arrows). Right panel: high magnification of H. (I) Section of a Bim−/− proximal mammary duct at six weeks. Note the squamous cell cluster embedded in secretion (black arrow). Right panel: high magnification of I. (J) Section of control mammary duct at 8 weeks. Note the presence of secretion in the luminal space. (K) Section of a hollowed Bim−/− proximal mammary duct at eight weeks with debris embedded in secretion (black arrow). (L) Section of a hollowed Bim−/− distal mammary duct at 8 weeks with ghost cells (white arrow) and debris (black arrow). [Scale bar: 10 (A–B), 3.5 (B insert), 50 (C–D), 20 (G-H-I), 6 (E-F-J-K-L, panels in G-H-I) μm]. Abbreviation: cc (cap cell), bd (body cell), sq (squamous); kp (keratin pearl).
Figure 4
Figure 4. Cell death, proliferation and cell differentiation at 5 weeks and caspase-independent cell death at six weeks in Bim−/− mammary glands
(A–B) TUNEL staining of representative wild type TEB (A) and Bim −/− TEB (B) at five weeks. (B) Residual TUNEL staining (black arrows) is observed in Bim−/− TEB at five weeks. (C–D) Immunostaining of cleaved (i.e. activated) caspase 3 (red) and β-catenin (green) in a representative wild type TEB (C) and Bim−/− TEB (D) at five weeks. (D) Small numbers of cleaved caspase 3 positive cells (white arrows) are observed in Bim−/− TEB at five weeks. (E) Quantification of TUNEL and cleaved caspase 3 positive cells expressed as mean ± SD in the TEB of five week old mice (n=5 per genotype). Percentages of TUNEL positive cells were 10.6% ± 1.7 in wild type and 1.1% ± 0.45 in Bim−/− TEBs. Percentage of cleaved caspase 3 positive cells were 10.7% ± 1.75 in wild type and 1.86% ± 0.38 in Bim−/− TEBs. (F–G) BrdU staining (black arrow) of representative wild type TEB (F) and a Bim−/− TEB (G) at five weeks. (H) Proliferation assay in TEB from five week-old mice (n=5 per genotype). The percentages of BrdU-positive cells were 28% ± 3.1 in wild type and 19.7% ± 4.2 in Bim−/− TEB (paired t-test with p<0.02). (I–J) MUC1 (green) and p63 (red) expression in wild type (I) and Bim−/− TEB (J). The insert in I shows a high magnification of MUC1 and p63 overlay from the dashed box. The upper insert in J shows a high magnification of MUC1 and p63 overlay from the dashed box. The lower insert in J shows MUC1 staining alone. Note that the p63 positive cells were MUC1 negative in the Bim−/− TEB (white asterisks). (K–L) Colocalization of β-CAT (green) and TUNEL (red) positive cells (white arrows) in Bim−/− clearing duct at 6 weeks by immunostaining. (L) High magnification of the cell cluster shown in K. Lower insert: corresponding DAPI staining (white asterisks). (M–O) Immunostaining of β-CAT (green) and cleaved caspase 3 (red) in filled Bim−/−duct at six weeks. (N) High magnification of the area labeled with a white asterisk in M. Note that luminal epithelial cells are organized into large isolated ductal islets (white arrow). (O) High magnification of dashed box in M. Upper and lower inserts show corresponding DAPI staining of dashed boxes in O. (P) Immunostaining of β-CAT (green) and TUNEL (red) positive cells in a keratin pearl with TUNEL-positive cells (white arrows). Right panel: DAPI staining of the main panel. (Q) Immunostaining of β-CAT (green) and cleaved caspase 3 (red) in compromised squamous cluster in Bim−/− duct at six weeks. Note the absence of β-CAT staining and the thin shape of nuclei in the peripheral cells (white arrows). (R) Quantification of TUNEL-positive (10.6 ± 0.8%, n=3) and cleaved Casp3 positive (0.75 ± 0.15%, n=4) cells in the ducts of six week old Bim−/− mice. Nuclei are in blue. [Scale bar: 6 (A, B, C, D, F, G, N), 8 (I, J), 4 (K, P, Q, insert in J), 12 (M), 2.5 (L, O) μm]. Abbreviation: β-Cat (β-catenin), Casp3* (cleaved caspase 3), MUC1 (Mucin-1).
Figure 5
Figure 5. Characterization of the inner cell population of the filled Bim−/− TEBs at five weeks
(A–B) Colocalization by immunostaining of β1-INT (green) and β-CAT (red) in a wild type (A) and a Bim−/− (B) TEB at five weeks. (B) Note that the highly positive β-CAT clusters are β1-INT-negative (white arrows and asterisks). The insert shows a high magnification of the β1-INT-negative clusters in dashed box (C–D) Immunostaining of β1-INT (green) and K14 (red) in a wild type (C) and a Bim−/− TEB (D) at five weeks. Nuclei are in blue. (D) The β1-INT negative cell clusters in the TEB express high levels of K14 (white arrow). The insert shows that β1-INTpos basal cells express K14 as well (dashed box in D). (E–F) BrdU incorporation (green) and p63 expression (red) in wild type (E) and Bim−/− TEB (F). Right panel in F: p63 and BrdU overlay of the dashed boxes shown in F. Note that the p63pos cells in the TEB body did not incorporate BrdU. (G–I) Immunostaining of β1-INT (green) and LN (red) in a wild type TEB (G) and Bim−/−TEB (H) at five weeks. (G) The insert shows cytoplasmic localization of LN in TEB basal cells (white arrows in G). (H) The β1-INT-negative cell clusters do not express LN (white asterisk). (I) Confocal imaging of basal cells in the TEB (see white arrow in H) showing a cytoplasmic localization of LN. (J) Confocal imaging of cap cells showing extracellular localization of LN. (K) Diagram summarizing the expression of differentiation markers in the cell populations present in a filled TEB at five weeks. Expressed proteins are in red and those not expressed in green. [Scale bar: 15 (A to H), 3 (I–J and G insert), 8 (A-B-D-F inserts) μm]. Abbreviation: β1-INT (β1-integrin), β-Cat (β-catenin), LN (Laminin), K14 (keratin 14), cc (cap cells), BrdU (Bromodeoxyuridine).
Figure 6
Figure 6. Characterization of the inner cell population of the filled Bim−/− ducts at five weeks
(A–C) Colocalization by immunostaining of p63 (green) and MUC-1 (red) in wild type (A) and Bim−/− (B–C) ducts (A) Note the apical localization of MUC-1 in luminal cells of the control duct while p63 expression is restricted to the myoepithelial cells. (B–C) Note that in the Bim−/− filled duct inner MUC1neg cells express p63 (white arrow). The lower panel in C shows confocal imaging of dashed box shown in the upper panel. Note the apical localization of MUC1 in the luminal/inner cells (double head white arrows). (D–F) Immunostaining of β1-INT (green) and βCAT (red) in a wild type hollowed duct (D) and Bim−/− filled TEB (E–F). The top insert in E shows a β1-INTneg. squamous cluster (white arrow). The lower insert in E shows a high magnification of the dashed box. (F) Corresponding β1-INT staining of right insert in E. Note that the squamous clusters are β1-INT-negative (white asterisks). (G–H) Indirect immunofluorescence for K10 (green) and K8 (red) in Bim+/+ (G) and Bim−/− (H) mammary ducts. (H) Note that only a subset of the K8-negative cells (white asterisks) are K10-positive. Right insert shows a high magnification of the left insert without DAPI staining. (I) Immunostaining of β1-INT (green) and K10 (red) of a keratin pearl in a filled distal Bim−/− duct. Lower insert: note that the keratin pearl is β1-INTneg. (J–L) Immunostaining of β1-INT (green) and LN (red) in a wild type (J) and Bim−/−distal duct (K–L). The insert in J: confocal imaging showing extracellular localization of LN in the mammary ducts. (L) Confocal imaging showing extracellular localization of LN at the level of the myoepithelial cells in the filled mammary ducts. (M) Diagram summarizing the expression of differentiation markers in the cell populations present in a filled Bim−/− distal duct at five weeks. Expressed proteins are in red and those not expressed are in green. [Scale bar: 15 (D-E-G-H-J-K), 10 (F, insert in E), 7 (A-B-C and insert in I), 3 (L and C–J inserts), 5.5 (H inserts) μm]. Abbreviation: myo (myoepithelial cells), lum (luminal cell), β1-INT (β1-integrin), β-Cat (β-catenin), LN (Laminin), MUC1 (Mucin-1), K8 (keratin 8), K10 (keratin10).
Figure 7
Figure 7. Squamous transdifferentiation of mammary epithelial cell lines in vitro
(A) Immunoblot showing K10 and FLG expression in attached cells and induction upon suspension at 24h and 72h in MCF-10A and HMEChTert cells. Note induction of BIM (Stressgen antibody AAP-330) in MCF-10A cells upon anoikis as described previously (Reginato et al., 2003). TUB was used as loading control. (B–C) K10 (green) and β1-INT (red) immunofluorescence on cytospin samples of attached cells (B) and cells in suspension for 24h (C). (D) Quantification of Keratin 10-positive MCF-10A cells for attached (7.24% ± 1.99) condition and after 24h (33.8% ± 3.46) or 48h (55% ± 2, p<0.001) in suspension. (E–F) FLG immunofluorescence on cytospin samples of attached cells (E) and cells in suspension for 24h (F). (G) Up-regulation of p38 MAPK pathway activity upon anoikis. Immunoblot showing up-regulation of phosphorylation of p38 MAPK and its upstream MAPKs, MKK3 and MKK6, upon suspension at 24h and 48h in MCF10A cells. Note that total level of MKK3 and MKK6 increased upon anoikis, while p38 MAPK protein did not change. TUB was used as a loading control. (H) Pharmacological inhibition of p38 MAPK activation suppressed K10 expression. SB203580 treatment (10μM in DMSO) decreased phosphorylation of p38 MAPK and prevented K10 up-regulation in suspension at 24h, while treatment with the carrier alone (DMSO) did not inhibit up-regulation of p38 MAPK phosphorylation and K10 protein expression. Note that total level of p38 MAPK protein does not change upon anoikis. TUB was used as a loading control. (I) Microphotography of HMEChTert acini after 20 days of culture. Note the “onion skin” shape of the inner cells (black arrow in low magnification panel). Lower panel: high magnification of the upper panel. Note the lumen (black asterisk). (J) Immunostaining for K10 (green) and LOR (red) in HMEChTert acini with a hollow lumen (white asterisk) at day 20. The dashed white line displays HMEChTert acinus borders. Insert: LOR staining alone with DAPI of the dashed box shown in the main panel. (K) Immunolocalization of K1 in HMEChTert acini at day 20. (L) Colocalization of β1-INT (green) and β-CAT (red) by immunostaining in HMEChTert acini at day 20. Note the absence of β1-INT expression in the squamous inner cells (double head arrow) and the faint DAPI staining in the center of the acinus (white arrows). [Scale bar: 15 (B-C-E-F), 430 (I), 180 (I insert), 35 (J–K), 45 (L) μm]. Abbreviation: att. and Attach. (attached), ano. (anoikis), sus. (suspension), sq. (squamous), β1-INT (β1-integrin), β-Cat (β-catenin), FLG (Filaggrin), LOR Lloricrin), K1 (keratin 1), K10 (keratin 10), P-MMK3/6 (phospho-MKK3/6), P-p38 (Phospho-p38 MAPK), TUB (tubulin).

References

    1. Boldogh I, Bacsi A, Choudhury BK, Dharajiya N, Alam R, Hazra TK, Mitra S, Goldblum RM, Sur S. ROS generated by pollen NADPH oxidase provide a signal that augments antigen-induced allergic airway inflammation. J Clin Invest. 2005;115:2169–2179. - PMC - PubMed
    1. Bouillet P, Cory S, Zhang LC, Strasser A, Adams JM. Degenerative disorders caused by Bcl-2 deficiency prevented by loss of its BH3-only antagonist Bim. Dev Cell. 2001;1:645–653. - PubMed
    1. Candi E, Schmidt R, Melino G. The cornified envelope: a model of cell death in the skin. Nat Rev Mol Cell Biol. 2005;6:328–340. - PubMed
    1. Carlsson H, Yhr M, Petersson S, Collins N, Polyak K, Enerback C. Psoriasin (S100A7) and calgranulin-B (S100A9) induction is dependent on reactive oxygen species and is downregulated by Bcl-2 and antioxidants. Cancer Biol Ther. 2005;4:998–1005. - PubMed
    1. Chipuk JE, Green DR. Do inducers of apoptosis trigger caspase-independent cell death? Nat Rev Mol Cell Biol. 2005;6:268–275. - PubMed

Publication types

MeSH terms