. 2007 Apr;143(4):1817-26.
doi: 10.1104/pp.106.090902. Epub 2007 Feb 2.

Diverse subcellular locations of cryptogein-induced reactive oxygen species production in tobacco Bright Yellow-2 cells

Affiliations

Diverse subcellular locations of cryptogein-induced reactive oxygen species production in tobacco Bright Yellow-2 cells

Cher Ashtamker et al. Plant Physiol. 2007 Apr.

Abstract

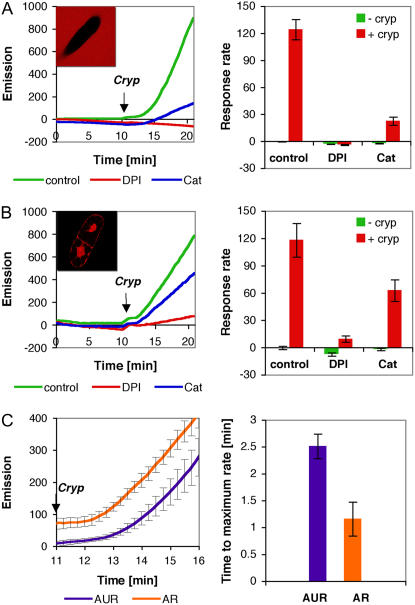
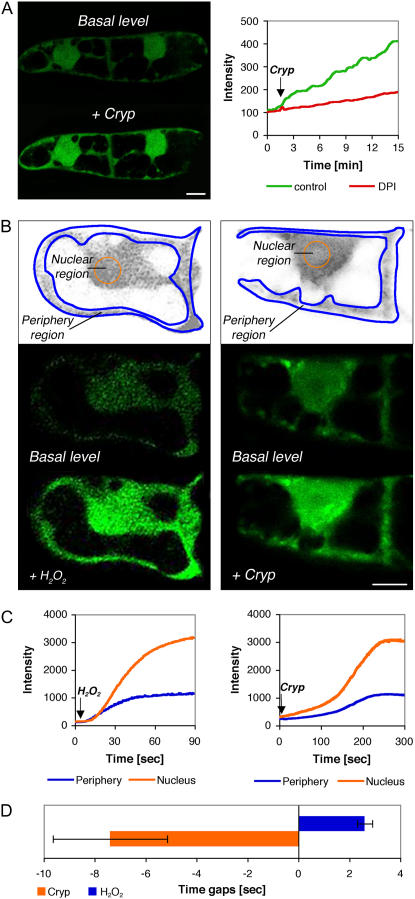
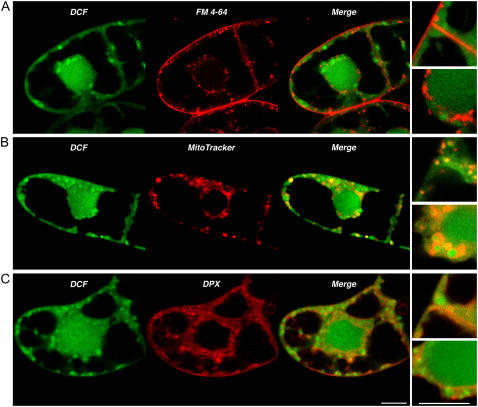
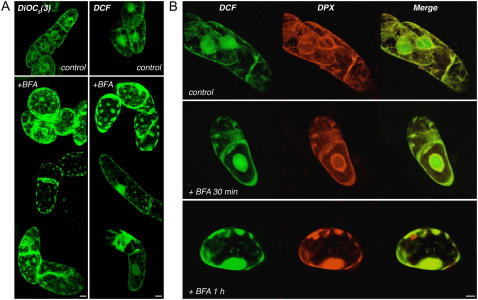
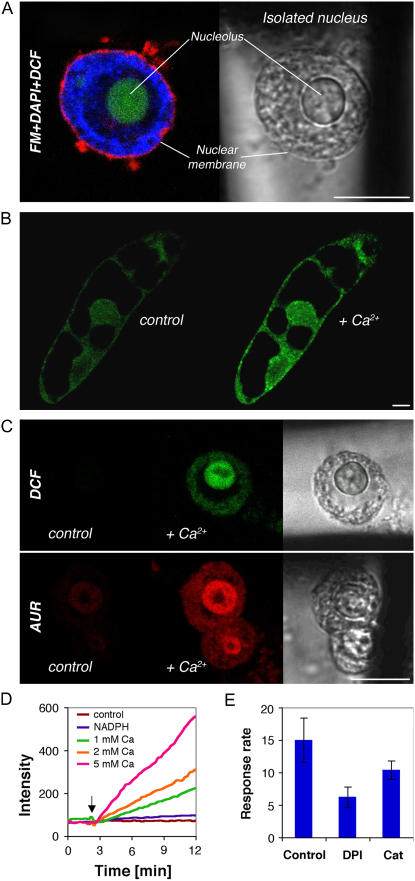
Reactive oxygen species (ROS) play a crucial role in many cellular responses and signaling pathways, including the oxidative burst defense response to pathogens. We have examined very early events in cryptogein-induced ROS production in tobacco (Nicotiana tabacum) Bright Yellow-2 suspension cells. Using Amplex Red and Amplex Ultra Red reagents, which report real-time H2O2 accumulation in cell populations, we show that the internal signal for H2O2 develops more rapidly than the external apoplastic signal. Subcellular accumulation of H2O2 was also followed in individual cells using the 2',7'-dichlorofluorescein diacetate fluorescent probe. Major accumulation was detected in endomembrane, cytoplasmic, and nuclear compartments. When cryptogein was added, the signal developed first in the nuclear region and, after a short delay, in the cell periphery. Interestingly, isolated nuclei were capable of producing H2O2 in a calcium-dependent manner, implying that nuclei can serve as a potential active source of ROS production. These results show complex spatial compartmentalization for ROS accumulation and an unexpected temporal sequence of events that occurs after cryptogein application, suggesting novel intricacy in ROS-signaling cascades.


Figures

Figure 1.
Figure 1.
Generation of H2O2 in cryptogein-treated BY-2 cells as reported by AR and AUR. A, AUR assay of cryptogein-treated cells. Left, Representative kinetics graph of H2O2 response to cryptogein (100 nm) as measured by fluorescence emission in the absence or presence of DPI (2 μm) and catalase (628 units/mL). Arrow indicates the addition of cryptogein. Left inset, Representative confocal image of cryptogein-treated cells in the presence of AUR reagent. Right, Maximal reaction response rates before and after cryptogein addition (average of five experiments ± sd). B, AR assay of cryptogein-treated cells as described in A. C, Measurement of the kinetics of H2O2 accumulation in cryptogein response. Left, Accumulation of H2O2 with AR and AUR after the addition (arrow) of cryptogein (n = 5, average ± sd). Right, Calculated time response to achieve maximal linear accumulation after the addition of cryptogein (±sd).
Figure 2.
Figure 2.
Subcellular accumulation of H2O2 in BY-2 cells after H2O2 and cryptogein addition as reported by DCF. A, Left inset, Optical section showing the DCF signal before and 13 min after the addition of 100 nm cryptogein. Right inset, Kinetics graph of response to cryptogein reported by DCF with or without the addition of DPI. B, Subcellular accumulation of H2O2. Left insets, DCF signal before and 75 s after external addition of 0.1 mm H2O2. Right insets, Image of DCF signal before and 5 min after addition of 100 nm cryptogein. Top insets in B, Division of the cell into periphery (blue line) and nuclear (orange line) regions. Scale bar in bottom right image = 10 μm. C, Kinetics graphs of signal intensity after H2O2 (left inset) and cryptogein (right inset) application. DCF signals were recorded from the designated periphery and nuclear subcellular compartments as shown in the top insets of B. D, Maximal rate of signal acquisition as measured in the periphery or nucleus expressed as the time gap. The time to achieve maximal rate of signal acquisition was measured in each compartment. The difference in start times was calculated as described in “Materials and Methods.” Negative values were defined when the nuclear compartment reacted before the periphery compartment. Averages of five experiments ± se are shown.
Figure 3.
Figure 3.
Imaging of H2O2 and subcellular-specific stains. A, Optical section of cells double stained with DCF and the membrane-specific marker FM 4-64. B, Optical section of cells double stained with DCF and mitochondrial-specific marker MitoTracker. C, Optical section of cells double stained with DCF and the ER-specific marker DPX. Right insets in each image are enlarged sections of the cell periphery (top inset) and the nuclear regions (bottom inset). Scale bars in bottom image = 10 μm.
Figure 4.
Figure 4.
Imaging of H2O2 and subcellular-specific stains in BFA-treated BY-2 cells. A, Cells were stained separately with the ER marker DiOC5(3) or DCF. Left insets, 3D reconstructions of cells stained with DiOC5(3). Right insets, 3D reconstructions of cells stained with DCF. Images of nontreated cells (control; top insets) and between 30 and 90 min of BFA treatment (bottom insets) were collected. B, Cells were double stained with DCF and the ER-specific marker DPX. Top inset, Nontreated cells showing DCF, DPX, and merge images; bottom insets, DCF, DPX, and merge images were collected at 30 min (middle inset) and 60 min (bottom inset) after BFA addition. Scale bar = 10 μm.
Figure 5.
Figure 5.
Imaging of H2O2 signal in BY-2 cells and isolated nuclei in response to calcium application, as reported by DCF and AUR. A, Merged optical section of isolated BY-2 nucleus triple stained with FM 4-64, DAPI, and DCF. B, Optical section of cells stained with DCF before and after the addition of 1 mm calcium. C, Optical section of isolated nuclei stained with DCF (top inset) and AUR (bottom inset) before (control) and after the addition of 1 mm calcium (+Ca2+), and transmission images of the isolated nuclei. Scale bar = 10 μm. D, Representative graph of calcium-dependent DCF response in isolated nuclei. E, Reaction rates after 1 mm calcium addition (average of at least five experiments ± sd).

References

    1. Allan AC, Fluhr R (1997) Two distinct sources of elicited reactive oxygen species in tobacco epidermal cells. Plant Cell 9 1559–1572 - PMC - PubMed
    1. Barcelo AR (2005) Xylem parenchyma cells deliver the H2O2 necessary for lignification in differentiating xylem vessels. Planta 220 747–756 - PubMed
    1. Binet MN, Humbert C, Lecourieux D, Vantard M, Pugin A (2001) Disruption of microtubular cytoskeleton induced by cryptogein, an elicitor of hypersensitive response in tobacco cells. Plant Physiol 125 564–572 - PMC - PubMed
    1. Bolte S, Talbot C, Boutte Y, Catrice O, Read ND, Satiat-Jeunemaitre B (2004) FM-dyes as experimental probes for dissecting vesicle trafficking in living plant cells. J Microsc (Oxf) 214 159–173 - PubMed
    1. Bourque S, Binet MN, Ponchet M, Pugin A, Lebrun-Garcia A (1999) Characterization of the cryptogein binding sites on plant plasma membranes. J Biol Chem 274 34699–34705 - PubMed

Publication types

LinkOut - more resources