. 2007 Apr 15;92(8):2944-52.
doi: 10.1529/biophysj.106.092981. Epub 2007 Feb 2.

ADP regulates movements of mitochondria in neurons

Affiliations

ADP regulates movements of mitochondria in neurons

Sergej L Mironov. Biophys J. .

Abstract

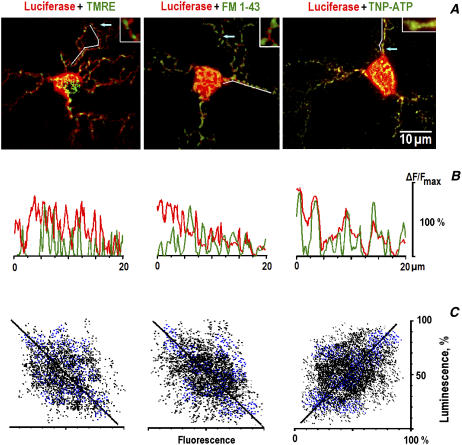
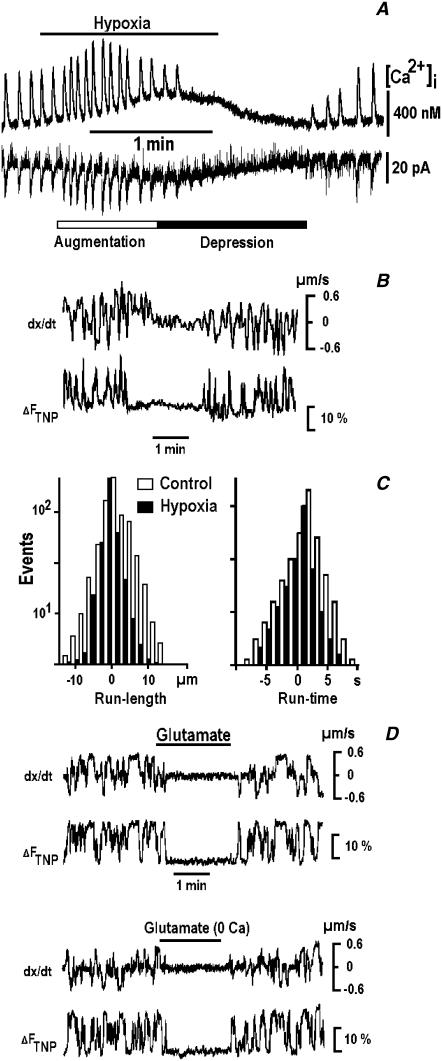
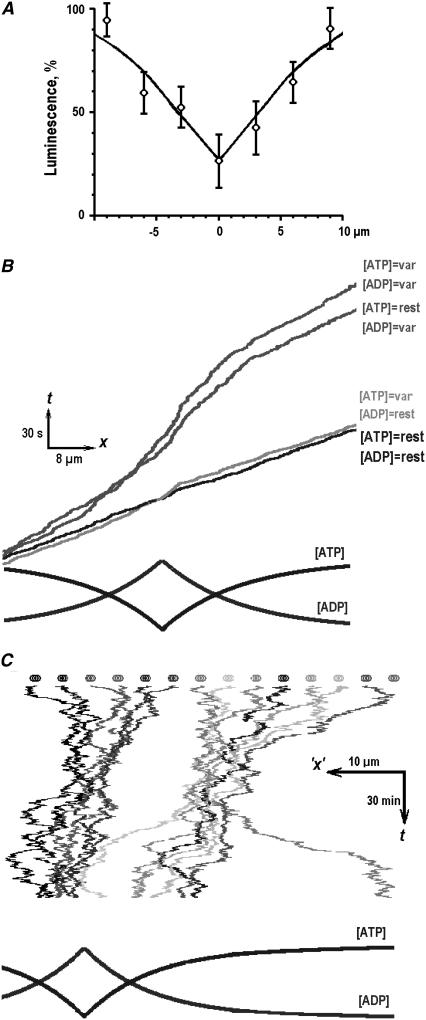
Mitochondria often reside in subcellular regions with high metabolic demands. We examined the mechanisms that can govern the relocation of mitochondria to these sites in respiratory neurons. Mitochondria were visualized using tetramethylrhodamineethylester, and their movements were analyzed by applying single-particle tracking. Intracellular ATP ([ATP](i)) was assessed by imaging the luminescence of luciferase, the fluorescence of the ATP analog TNP-ATP, and by monitoring the activity of K(ATP) channels. Directed movements of mitochondria were accompanied by transient increases in TNP-ATP fluorescence. Application of glutamate and hypoxia reversibly decreased [ATP](i) levels and inhibited the directed transport. Injections of ATP did not rescue the motility of mitochondria after its inhibition by hypoxia. Introduction of ADP suppressed mitochondrial movements and occluded the effects of subsequent hypoxia. Mitochondria decreased their velocity in the proximity of synapses that correlated with local [ATP](i) depletions. Using a model of motor-assisted transport and Monte Carlo simulations, we showed that mitochondrial traffic is more sensitive to increases in [ADP](i) than to [ATP](i) depletions. We propose that consumption of synaptic ATP can produce local increases in [ADP](i) and facilitate the targeting of mitochondria to synapses.


Figures

FIGURE 1
FIGURE 1
Correlation among the positions of mitochondria, synaptic vesicles, and ATP. (A) Merged images of TMRE, FM 1-43, and TNP-ATP fluorescence (green) and the luminescence of luciferase (red). The arrows indicate the positions of enlarged (×8) areas shown in insets. (B) Curvilinear line scans of fluorescence (green) and luminescence (red) in dendrites are indicated by the white lines in A. The data were normalized to the maximal luminescence (fluorescence) in the respective frames. Note the negative (TMRE, FM 1-43) and the positive (TNP-ATP) correlations with the luminescence of luciferase in the corresponding line scans. (C) Spatial correlation between the luminescence and fluorescence signals. The black and blue dots indicate the amplitude of respective pixels in the soma and in dendrites. Linear regression gave the slopes of straight lines 1.05 (A), 0.97 (B), and 0.92 (C), respectively, and all correlation coefficients are >0.95. The differences between the overlap in the soma and those in dendrites were insignificant.
FIGURE 2
FIGURE 2
Suppression of mitochondrial mobility by hypoxia and glutamate. (A) Rhythmic [Ca2+]i transients (upper trace) and electrical activity (lower trace) are modulated by hypoxia. The measurements were made in fura-2-loaded respiratory neurons using perforated whole-cell patch-clamp recordings as described in Methods. (B) Mitochondrial movements during hypoxia and their correlation with local changes in TNP-ATP fluorescence. The two traces show the changes in instantaneous mitochondrial velocity (dx/dt) and in the TNP-ATP fluorescence (ΔFTNP). The time-dependent changes were measured in moving regions that encircled single mitochondria in dendrites. The positive and negative step-like changes in velocity correspond to the antero- and retrograde transport, respectively. (C) The run times and run lengths of mitochondria measured 3 min before (open bars) and 3 min after applying hypoxia (solid bars). (D) Inhibition of mitochondrial mobility by glutamate (1 mM) in Ca2+-containing and Ca2+-free solutions. Note that both fluorescence transients and directed movements were reversibly inhibited during the applications of hypoxia and glutamate.
FIGURE 3
FIGURE 3
Movements of mitochondria are differentially influenced by ATP and ADP. (A) Hypoxia and ATP. The trajectories of mitochondria in dendrites were repositioned to begin at the same point for comparison. Note that inhibition of mobility by hypoxia was not reversed after injection of 0.4 mM ATP. (B) ATP (0.4 mM) reverses hypoxic activation of ATP-sensitive K+ (KATP) channels. Mean open probabilities of the channels (Popen) are indicated near each trace. (C) ADP and hypoxia. Note that after suppression of mitochondrial movements by injection of 0.4 mM ADP, hypoxia produced no effect. All presented trajectories were obtained by applying SPT to the 3-min-long recordings of mitochondrial movements in the control and after the treatments. Note decreases in the lengths of continuous directed movements of mitochondria during hypoxia and at elevated [ADP]i levels.
FIGURE 4
FIGURE 4
Mitochondrial transport in nonuniform fields of [ATP]i and [ADP]i. (A) Mean [ATP] profile in dendrites. The data were obtained from the luminescence scans (21 in total), which were aligned according to the maxima of FM 1-43 fluorescence in dendrites identified as synaptic locations (see Methods). The experimental data points were approximated by Eq. 2 with the parameters C0 = 1 mM (the resting [ATP]i), C1 = 0.2 mM ([ATP]i at synapse), and the space constant 1/λ = 6 μm. (B) Monte Carlo simulations of the directed transport of mitochondria. The four kymographs show the results of simulations at resting [ATP]i = 1 mM and [ADP]i = 0.1 mM (denoted as “rest”), in varying profiles of [ATP]i and [ADP]i (denoted as “var”), and by using the profiles of either [ADP]i or [ATP]i with the concentration of another nucleotide fixed (the conditions of simulations are indicated near each curve). (C) Monte Carlo simulations of 16 mitochondria. The kymograph shows a 2-h-long simulation run performed using prescriptions described in Methods. Mitochondria were assumed to move bidirectionally in nonuniform profiles of [ATP]i and [ADP]i (shown in the lowermost panel), which models the concentration gradients in the vicinity of persistently active synapses.

References

    1. Bereiter-Hahn, J., and M. Voth. 1994. Dynamics of mitochondria in living cells: shape changes, dislocations, fusion, and fission of mitochondria. Microsc. Res. Tech. 27:198–219. - PubMed
    1. Wong-Riley, M., and E. W. Carroll. 1984. Effect of impulse blockage on cytochrome oxidase activity in monkey visual system. Nature. 307:262–264. - PubMed
    1. Morris, R. L., and P. J. Hollenbeck. 1995. Axonal transport of mitochondria along microtubules and F-actin in living vertebrate neurons. J. Cell Biol. 131:1315–1326. - PMC - PubMed
    1. Mironov, S. L. 2006. Spontaneous and evoked neuronal activities regulate movements of single neuronal mitochondria. Synapse. 59:403–411. - PubMed
    1. Overly, C. C., H. J. Rieff, and P. J. Hollenbeck. 1996. Organelle motility and metabolism in axons vs. dendrites of cultured hippocampal neurons. J. Cell Sci. 109:971–980. - PubMed

Substances

LinkOut - more resources