. 2007 Apr 15;92(8):2964-74.
doi: 10.1529/biophysj.106.089730. Epub 2007 Feb 2.

Cell spreading and focal adhesion dynamics are regulated by spacing of integrin ligands

Affiliations

Cell spreading and focal adhesion dynamics are regulated by spacing of integrin ligands

Elisabetta Ada Cavalcanti-Adam et al. Biophys J. .

Abstract

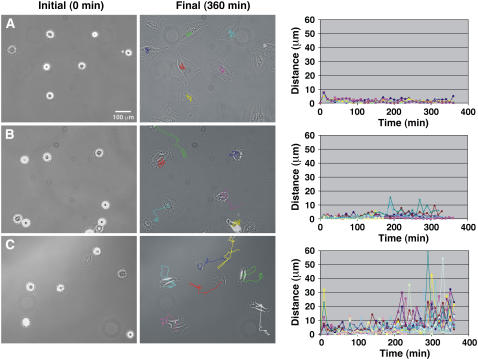
Integrin-mediated adhesion is regulated by multiple features of the adhesive surface, including its chemical composition, topography, and physical properties. In this study we investigated integrin lateral clustering, as a mechanism to control integrin functions, by characterizing the effect of nanoscale variations in the spacing between adhesive RGD ligands on cell spreading, migration, and focal adhesion dynamics. For this purpose, we used nanopatterned surfaces, containing RGD-biofunctionalized gold dots, surrounded by passivated gaps. By varying the spacing between the dots, we modulated the clustering of the associated integrins. We show that cell-surface attachment is not sensitive to pattern density, whereas the formation of stable focal adhesions and persistent spreading is. Thus cells plated on a 108-nm-spaced pattern exhibit delayed spreading with repeated protrusion-retraction cycles compared to cells growing on a 58-nm pattern. Cell motility on these surfaces is erratic and nonpersistent, leaving thin membrane tethers bound to the RGD pattern. Dynamic molecular profiling indicated that the adhesion sites formed with the 108-nm pattern undergo rapid turnover and contain reduced levels of zyxin. These findings indicate that a critical RGD density is essential for the establishment of mature and stable integrin adhesions, which, in turn, induce efficient cell spreading and formation of focal adhesions.


Figures

FIGURE 1
FIGURE 1
Phase contrast images of a cell spreading on surfaces presenting (A) homogeneously coated with RGD peptide, (B) 58-nm RGD-nanopattern, and (C) 108-nm RGD nanopattern. In panels B and C SEM micrographs of the nanopatterned surfaces are shown and the average spacing between gold nanoparticles, determined by measuring different fields of several samples, is indicated in the upper part (± SD). The kinetics of cell spreading are determined by measuring the cell area as a function of time (time 0 is the initial time of adhesion). Area values are normalized to the average of the maximum values of the control group. Each line in the plot is a measurement of a cell on that type of surface and the dotted black lines indicate the transition from initial spreading to stabilization phase. The lines corresponding to the cell shown in the image sequences are indicated in the lower right corner. The whole movie can be found in the online Supplementary Material.
FIGURE 2
FIGURE 2
Analysis of lamellipodial protrusion in REF52 cells, adhering to (A) homogenously modified RGD surface, (B) 58-nm, and (C) 108-nm RGD nanopattern. The initial time corresponds to the first appearance of the lamellipodia in the cell (for A and B, 5–7 min after attachment; for C, 30 min). The edge displacement along the three colored lines was monitored for 160 min at 30-s intervals using kymograms. The central plots show the rate of displacement over time. The plots on the right indicate the distribution of the number of protrusion and retraction events for each sample.
FIGURE 3
FIGURE 3
FRIT images (fluorescence ratio of images at different time points) of movies showing REF cells transfected with YFP-paxillin on (A) control surface, (B) 58-nm, and (C) 108-nm RGD-nanopattern. Upper panels show the initial time point after 3 h of plating cells on surfaces; lower panels show the same region after 1 h. Images were taken during the following 2 h of spreading at 1-min intervals. The images are temporal ratios of two consecutive frames: structures that appear only at the later image are shown in blue, whereas structures present at the earlier time point are red. Unchanged paxillin locations are represented in yellow. The whole movie (color and ratio) can be found in the online Supplementary Material.
FIGURE 4
FIGURE 4
Immunostaining and fluorescence ratio images (FRI) of focal adhesion proteins. REF52 cells transfected with GFP-integrin β3 were fixed and immunostained with primary antibody against vinculin, followed by Cy5-conjugated secondary antibodies. Actin filaments were visualized with phalloidin-TRITC. Cells on 58-nm and 108-nm RGD-nanopatterns were observed at 3 h and 24 h after plating. The rows present the images with integrin β3 in red, vinculin in blue, and actin in green. The last row shows the ratio between integrin β3 and vinculin intensities. FRI are presented in a spectrum scale as indicated in the lookup table.
FIGURE 5
FIGURE 5
Immunostaining and FRI of focal adhesion proteins. REF52 cells transfected with YFP-paxillin were fixed and immunostained with primary antibody against vinculin, followed by Cy5-conjugated secondary antibodies. Actin filaments were visualized with phalloidin-TRITC. Cells on 58-nm and 108-nm RGD-nanopatterns were observed at 3 h and 24 h after plating. The rows present the images with paxillin in red, vinculin in blue, and actin in green. The last row shows the ratio between paxillin and vinculin intensities. FRI are presented in a spectrum scale as indicated in the lookup table.
FIGURE 6
FIGURE 6
Immunostaining and FRI of focal adhesion proteins. REF52 cells transfected with YFP-paxillin were fixed and immunostained with primary antibody against zyxin, followed by Cy5-conjugated secondary antibodies. Actin filaments were visualized with phalloidin-TRITC. Cells on 58-nm and 108-nm RGD-nanopatterns were observed at 3 h and 24 h after plating. The rows present the images with paxillin in red, zyxin in blue, and actin in green. The last row shows the ratio between paxillin and zyxin intensities. FRI are presented in a spectrum scale as indicated in the lookup table.
FIGURE 7
FIGURE 7
Fibroblasts on 108-nm RGD-nanopattern 3 h after adhesion. (A) TIRF image of REF cell expressing GFP-integrin β3. (BD) Fibroblast adhering to nanopattern and its membrane structures have been visualized by SEM.
FIGURE 8
FIGURE 8
Cell motility on surfaces presenting (A) homogeneous coating of RGD peptides, (B) 58-nm RGD-nanopattern, and (C) 108-nm RGD nanopattern. The center of mass of cells adhering to the surfaces has been measured; plots show the velocity of several cells by evaluating the change in position of the center of mass (indicated as distance in μm) as a function of time (min). The initial time of measurement is the beginning of cell spreading. In the final image after 360 min, cell trajectories are indicated by colored lines. Each line in the plot corresponds to measurements of a single cell. The whole movie can be found in the online Supplementary Material.

Similar articles

Cited by

References

    1. Hynes, R. O. 1987. Integrins: a family of cell surface receptors. Cell. 48:549–554. - PubMed
    1. Pavalko, F. M., and C. A. Otey. 1994. Role of adhesion molecule cytoplasmic domains in mediating interactions with the cytoskeleton. Proc. Soc. Exp. Biol. Med. 205:282–293. - PubMed
    1. Geiger, B., and A. D. Bershadsky. 2001. Transmembrane crosstalk between the extracellular matrix-cytoskeleton crosstalk. Nat. Rev. Mol. Cell Biol. 2:793–805. - PubMed
    1. Ruoslahti, E. 1996. RGD and other recognition sequences for integrins. Annu. Rev. Cell Dev. Biol. 12:697–715. - PubMed
    1. Yamada, K. M., and B. Geiger. 1997. Molecular interactions in cell adhesion complexes. Curr. Opin. Cell Biol. 9:76–85. - PubMed

Publication types

LinkOut - more resources