

Green autofluorescence in dinoflagellates, diatoms, and other microalgae and its implications for vital staining and morphological studies
- PMID: 17277199
- PMCID: PMC1855647
- DOI: 10.1128/AEM.01741-06
Green autofluorescence in dinoflagellates, diatoms, and other microalgae and its implications for vital staining and morphological studies
Abstract
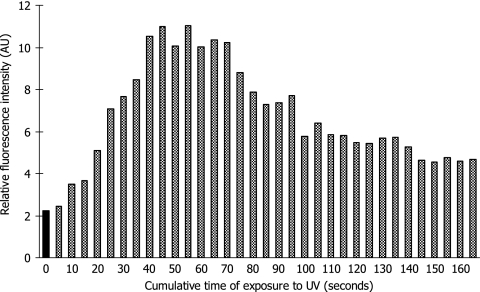
Green autofluorescence (GAF) has been described in the short flagellum of golden and brown algae, the stigma of Euglenophyceae, and cytoplasm of different life stages of dinoflagellates and is considered by some researchers a valuable taxonomic feature for dinoflagellates. In addition, green fluorescence staining has been widely proposed or adopted to measure cell viability (or physiological state) in areas such as apoptosis of phytoplankton, pollutant stresses on algae, metabolic activity of algae, and testing treatment technologies for ships' ballast water. This paper reports our epifluorescence microscopic observations and quantitative spectrometric measurements of GAF in a broad phylogenetic range of microalgae. Our results demonstrate GAF is a common feature of dinoflagellates, diatoms, green algae, cyanobacteria, and raphidophytes, occurs in the cytoplasm and particularly in eyespots, accumulation bodies, spines, and aerotopes, and is caused by molecules other than chlorophyll. GAF intensity increased with time after cell death or fixation and with excitation by blue or UV light and was affected by pH. GAF of microalgae may be only of limited value in taxonomy. It can be strong enough to interfere with the results of green fluorescence staining, particularly when stained samples are observed microscopically. GAF is useful, however, for microscopic study of algal morphology, especially to visualize cellular components such as eyespots, nucleus, aerotopes, spines, and chloroplasts. Furthermore, GAF can be used to visualize and enumerate dinoflagellate cysts in marine and estuarine sediments in the context of anticipating and monitoring harmful algal blooms and in tracking potentially harmful dinoflagellates transported in ships' ballast tanks.
Figures


Similar articles
-
Measuring viability of dinoflagellate cysts and diatoms with stains to test the efficiency of facsimile treatments possibly applicable to ships' ballast water and sediment.Harmful Algae. 2022 May;114:102220. doi: 10.1016/j.hal.2022.102220. Epub 2022 Mar 12. Harmful Algae. 2022. PMID: 35550298
-
Survey on germination and species composition of dinoflagellates from ballast tanks and recent sediments in ports on the South Coast of Finland, North-Eastern Baltic Sea.Mar Pollut Bull. 2006 Aug;52(8):900-11. doi: 10.1016/j.marpolbul.2005.11.028. Epub 2006 Jan 25. Mar Pollut Bull. 2006. PMID: 16442131
-
Study on the dinoflagellate cysts in ballast tank sediments of international vessels in Chinese shipyards.Mar Environ Res. 2021 Jul;169:105348. doi: 10.1016/j.marenvres.2021.105348. Epub 2021 Apr 28. Mar Environ Res. 2021. PMID: 33991936
-
Cryopreservation of microalgae and cyanobacteria.Methods Mol Biol. 2007;368:141-51. doi: 10.1007/978-1-59745-362-2_10. Methods Mol Biol. 2007. PMID: 18080468 Review.
-
Acclimation and toxicity of high ammonium concentrations to unicellular algae.Mar Pollut Bull. 2014 Mar 15;80(1-2):8-23. doi: 10.1016/j.marpolbul.2014.01.006. Epub 2014 Feb 15. Mar Pollut Bull. 2014. PMID: 24533997 Review.
Cited by
-
Extract from the zooxanthellate jellyfish Cotylorhiza tuberculata modulates gap junction intercellular communication in human cell cultures.Mar Drugs. 2013 May 22;11(5):1728-62. doi: 10.3390/md11051728. Mar Drugs. 2013. PMID: 23697954 Free PMC article.
-
Genome Sequence and Composition of a Tolyporphin-Producing Cyanobacterium-Microbial Community.Appl Environ Microbiol. 2017 Sep 15;83(19):e01068-17. doi: 10.1128/AEM.01068-17. Print 2017 Oct 1. Appl Environ Microbiol. 2017. PMID: 28754701 Free PMC article.
-
DNA-Specific DAPI Staining of the Pyrenoid Matrix During its Fission in Dunaliella salina (Dunal) Teodoresco (Chlorophyta).Curr Microbiol. 2020 Nov;77(11):3450-3459. doi: 10.1007/s00284-020-02159-0. Epub 2020 Aug 11. Curr Microbiol. 2020. PMID: 32780204
-
Maintenance of coastal surface blooms by surface temperature stratification and wind drift.PLoS One. 2013 Apr 11;8(4):e58958. doi: 10.1371/journal.pone.0058958. Print 2013. PLoS One. 2013. PMID: 23593127 Free PMC article.
-
Enumerating sparse organisms in ships' ballast water: why counting to 10 is not so easy.Environ Sci Technol. 2011 Apr 15;45(8):3539-46. doi: 10.1021/es102790d. Epub 2011 Mar 24. Environ Sci Technol. 2011. PMID: 21434685 Free PMC article.
References
-
- Anderson, D. M., Y. Fukuyo, and K. Matsuoka. 2003. Cyst methodologies, p. 165-190. In G. M. Hallegraeff, D. M. Anderson, and A. D. Cembella. (ed.), Manual on harmful marine microalgae. Monographs on Oceanographic Methodology 11. UNESCO, Paris, France.
-
- Anderson, D. M., B. A. Keafer, D. J. McGillicuddy, M. J. Mickelson, K. E. Keay, P. Scott Libby, J. P. Manning, C. A. Mayo, D. K. Whittaker, J. Michael Hickey, R. Y. He, D. R. Lynch, and K. W. Smith. 2005. Initial observations of the 2005 Alexandrium fundyense bloom in southern New England: general patterns and mechanisms. Deep-Sea Res. 52:2856-2876.
-
- Anderson, D. M., C. A. Stock, B. A. Keafer, A. Bronzino Nelson, D. J. McGillicuddy, M. Keller, B. Thompson, P. A. Matrai, and J. Martin. 2005. Alexandrium fundyense cyst dynamics in the Gulf of Maine. Deep-Sea Res. 52:2522-2542.
-
- Berglund, D. L., and S. Eversman. 1988. Flow cytometric measurement of pollutant stresses on algal cells. Cytometry 9:150-155. - PubMed
-
- Bolch, C. J. S. 1997. The use of sodium polytungstate for the separation and concentration of living dinoflagellate cysts from marine sediments. Phycologia 36:472-478.
Publication types
MeSH terms
Substances
Grants and funding
LinkOut - more resources
Full Text Sources
