

The stress protein gp96 is not an activator of resting rat bone marrow-derived dendritic cells, but is a costimulator and activator of CD3+ T cells
- PMID: 17278885
- PMCID: PMC1712683
- DOI: 10.1379/csc-208.1
The stress protein gp96 is not an activator of resting rat bone marrow-derived dendritic cells, but is a costimulator and activator of CD3+ T cells
Abstract
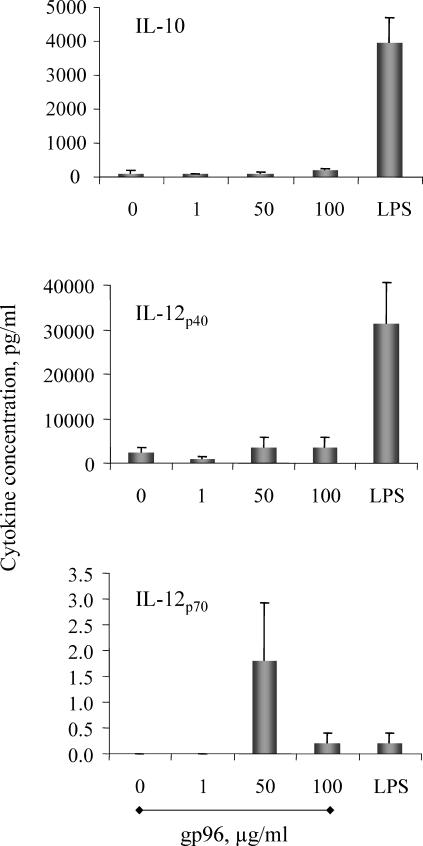
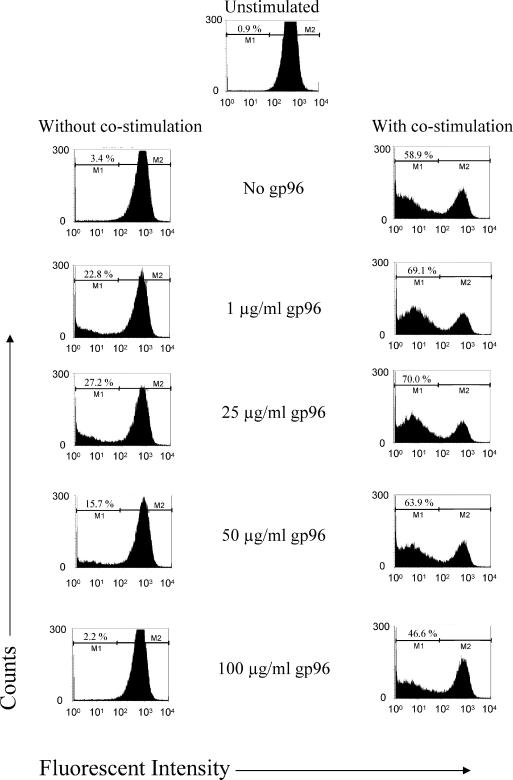
Although low doses of tumor-derived stress protein gp96 elicit protective immunity to the tumor from which it is isolated, protection is lost at high doses because of the induction of immunoregulatory CD4+ T cells. This study evaluated the influence of gp96 on resting rat bone marrow-derived dendritic cells (BMDCs) and purified CD3+ T cells. In contrast to previous reports, gp96 had no effect on adhesion and costimulatory molecule expression by BMDCs, nor did it influence interleukin (IL)-10 and IL-12 secretion or their allostimulatory capacity. Gp96 did not bind to BMDCs but dose-dependently bound to CD4+ and CD8+ T cells. At low concentrations (1 and 25 microg/mL), gp96 acted as a costimulator of CD3+ T cells, inducing proliferation and the secretion of interferon (IFN)-gamma- and IL-10. Gp96 also increased the proliferation of CD28-costimulated CD3+ T cells and their secretion of IFN-gamma, IL-4, and IL-10. Gp96 had no effect at higher concentrations (50 and 100 microg/mL), despite the occurrence of cell surface binding at these concentrations. These findings indicate that gp96 can act as a costimulatory molecule for CD3+ T cells, and an observed increase in the IL-10: IFN-gamma secretion ratio induced by gp96 suggests that it might, at appropriate concentrations, promote a regulatory T-helper 2 (Th2)-like phenotype.
Figures


Similar articles
-
Administration of the stress protein gp96 prolongs rat cardiac allograft survival, modifies rejection-associated inflammatory events, and induces a state of peripheral T-cell hyporesponsiveness.Cell Stress Chaperones. 2007 Spring;12(1):71-82. doi: 10.1379/csc-237r.1. Cell Stress Chaperones. 2007. PMID: 17441509 Free PMC article.
-
Identification of a rat bone marrow-derived dendritic cell population which secretes both IL-10 and IL-12: evidence against a reciprocal relationship between IL-10 and IL-12 secretion.Immunobiology. 2006;211(5):391-402. doi: 10.1016/j.imbio.2006.02.001. Epub 2006 Mar 14. Immunobiology. 2006. PMID: 16716808
-
Antigen presentation and immune regulatory capacity of immature and mature-enriched antigen presenting (dendritic) cells derived from human bone marrow.Hum Immunol. 2004 Feb;65(2):93-103. doi: 10.1016/j.humimm.2003.11.002. Hum Immunol. 2004. PMID: 14969764
-
Costimulation by purified intercellular adhesion molecule 1 and lymphocyte function-associated antigen 3 induces distinct proliferation, cytokine and cell surface antigen profiles in human "naive" and "memory" CD4+ T cells.J Exp Med. 1994 Dec 1;180(6):2125-35. doi: 10.1084/jem.180.6.2125. J Exp Med. 1994. PMID: 7525848 Free PMC article.
-
Regulation of T-cell activation: differences among T-cell subsets.Immunol Rev. 1989 Oct;111:79-110. doi: 10.1111/j.1600-065x.1989.tb00543.x. Immunol Rev. 1989. PMID: 2534116 Review.
Cited by
-
Extracellular cell stress (heat shock) proteins-immune responses and disease: an overview.Philos Trans R Soc Lond B Biol Sci. 2018 Jan 19;373(1738):20160522. doi: 10.1098/rstb.2016.0522. Philos Trans R Soc Lond B Biol Sci. 2018. PMID: 29203707 Free PMC article. Review.
-
A non-receptor-mediated mechanism for internalization of molecular chaperones.Methods. 2007 Nov;43(3):238-44. doi: 10.1016/j.ymeth.2007.06.007. Methods. 2007. PMID: 17920521 Free PMC article.
-
A case of mistaken identity: HSPs are no DAMPs but DAMPERs.Cell Stress Chaperones. 2012 May;17(3):281-92. doi: 10.1007/s12192-011-0311-5. Epub 2011 Dec 3. Cell Stress Chaperones. 2012. PMID: 22139593 Free PMC article.
-
Heat shock proteins are no DAMPs, rather 'DAMPERs'.Nat Rev Immunol. 2011 Jul 25;11(8):565; author reply 565. doi: 10.1038/nri2873-c1. Nat Rev Immunol. 2011. PMID: 21785457 No abstract available.
-
Administration of the stress protein gp96 prolongs rat cardiac allograft survival, modifies rejection-associated inflammatory events, and induces a state of peripheral T-cell hyporesponsiveness.Cell Stress Chaperones. 2007 Spring;12(1):71-82. doi: 10.1379/csc-237r.1. Cell Stress Chaperones. 2007. PMID: 17441509 Free PMC article.
References
-
- Banerjee PP, Vinay DS, and Mathew A. et al. 2002 Evidence that glycoprotein 96 (B2), a stress protein, functions as a Th2-specific costimulatory molecule. J Immunol. 169:3507–3518. - PubMed
Publication types
MeSH terms
Substances
Grants and funding
LinkOut - more resources
Full Text Sources
Research Materials