

Conformation and lipid binding of a C-terminal (198-243) peptide of human apolipoprotein A-I
- PMID: 17279626
- PMCID: PMC2518689
- DOI: 10.1021/bi061721z
Conformation and lipid binding of a C-terminal (198-243) peptide of human apolipoprotein A-I
Abstract
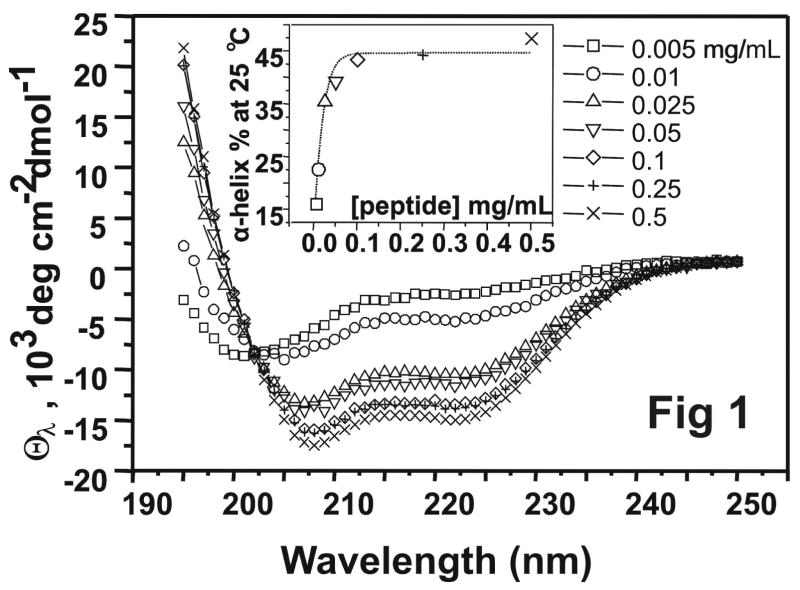
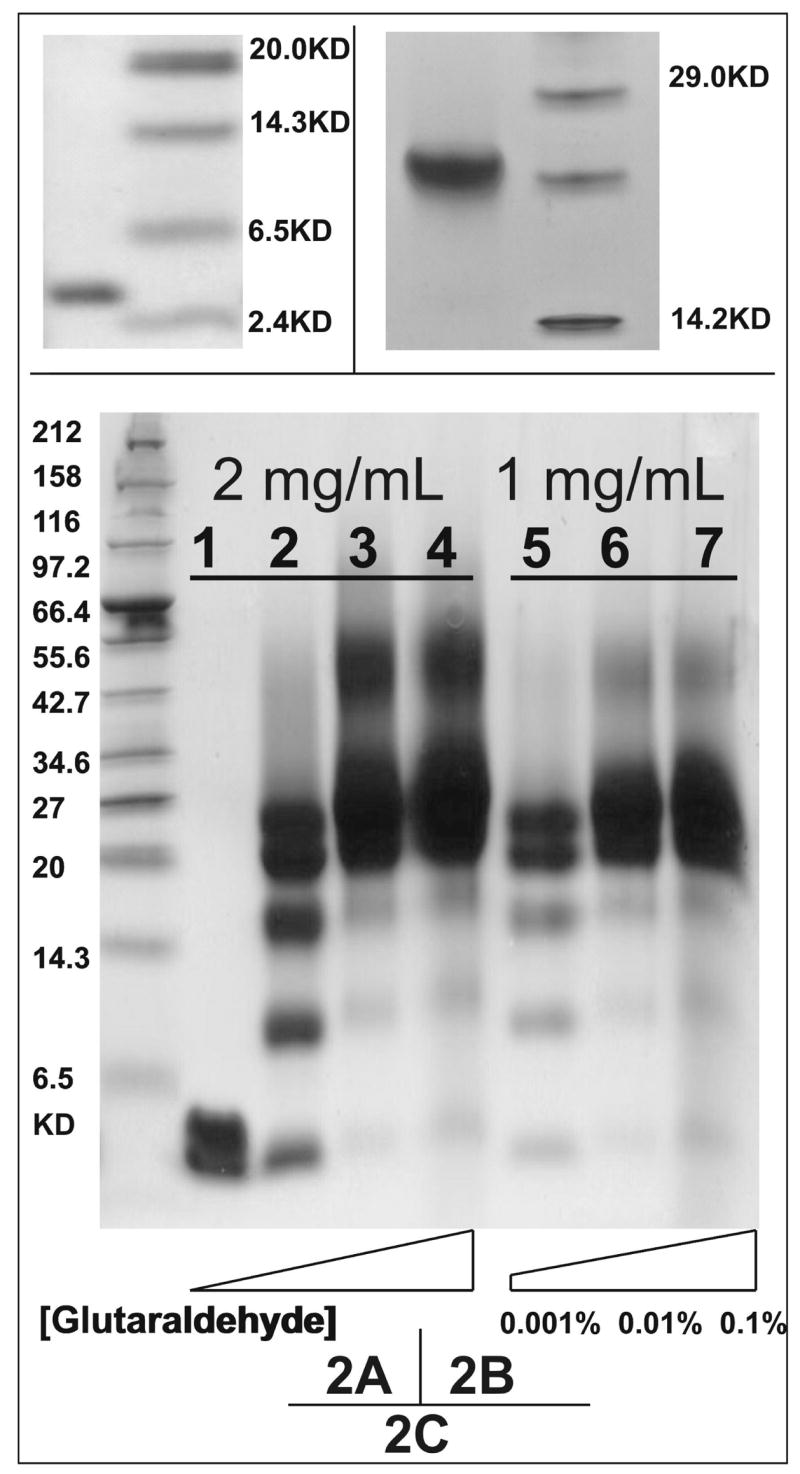
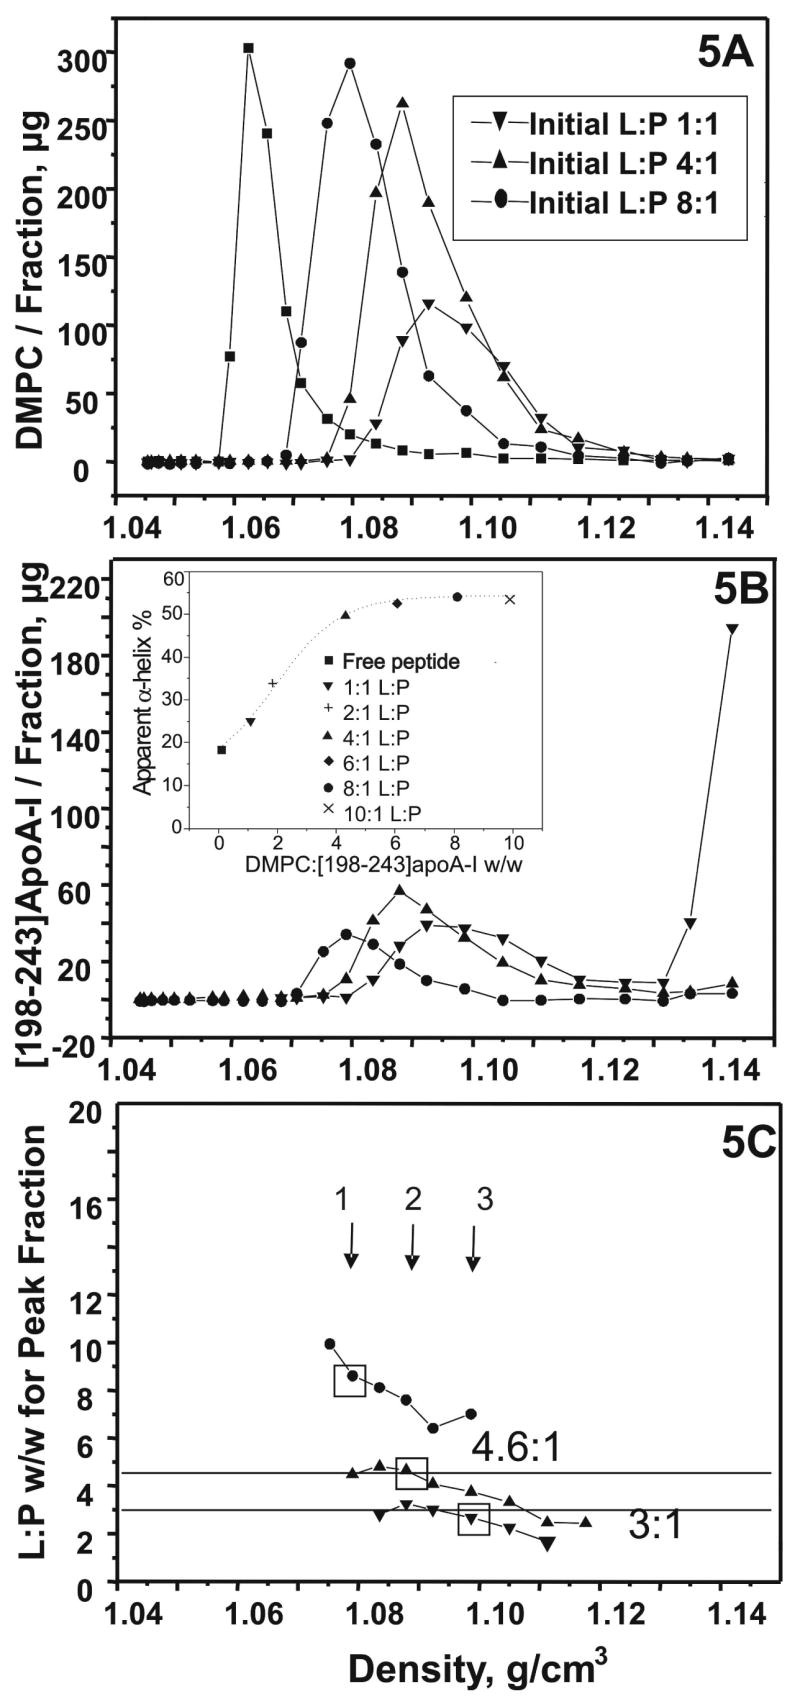
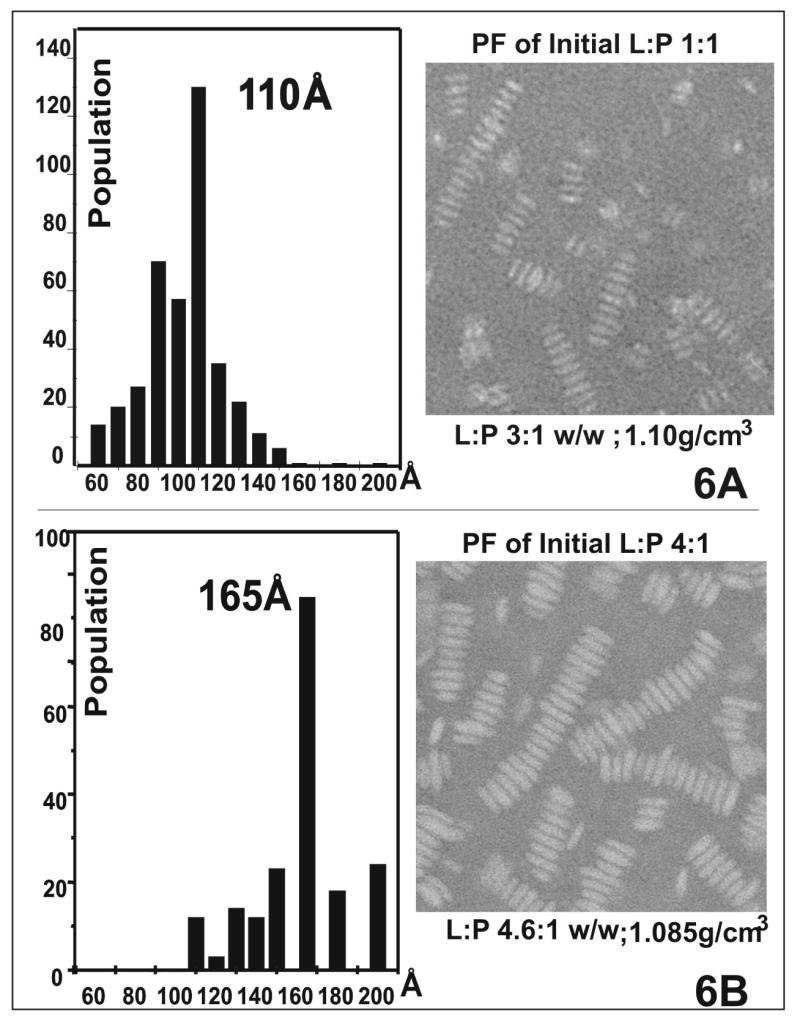
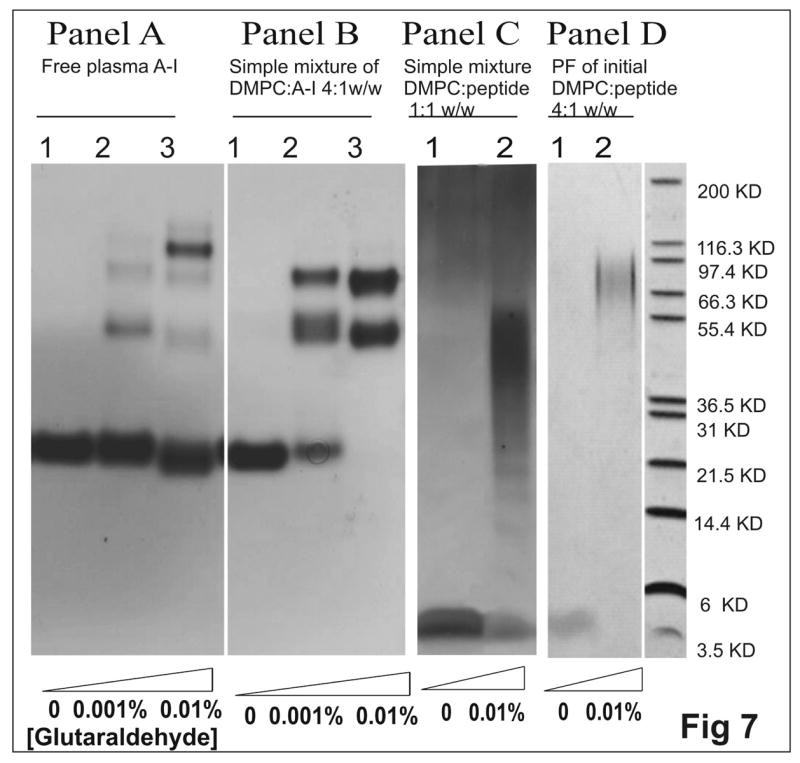
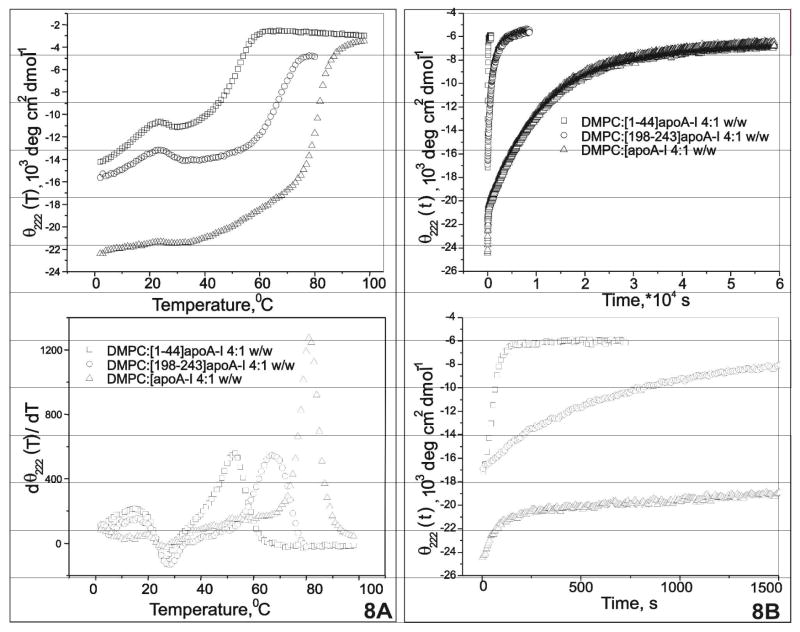
Human apolipoprotein A-I (apoA-I) is the principle apolipoprotein of high-density lipoproteins that are critically involved in reverse cholesterol transport. The intrinsically flexibility of apoA-I has hindered studies of the structural and functional details of the protein. Our strategy is to study peptide models representing different regions of apoA-I. Our previous report on [1-44]apoA-I demonstrated that this N-terminal region is unstructured and folds into approximately 60% alpha-helix with a moderate lipid binding affinity. We now present details of the conformation and lipid interaction of a C-terminal 46-residue peptide, [198-243]apoA-I, encompassing putative helix repeats 10 and 9 and the second half of repeat 8 from the C-terminus of apoA-I. Far-ultraviolet circular dichroism spectra show that [198-243]apoA-I is also unfolded in aqueous solution. However, self-association induces approximately 50% alpha-helix in the peptide. The self-associated peptide exists mainly as a tetramer, as determined by native electrophoresis, cross-linking with glutaraldehyde, and unfolding data from circular dichroism (CD) and differential scanning calorimetry (DSC). In the presence of a number of lipid-mimicking detergents, above their CMC, approximately 60% alpha-helix was induced in the peptide. In contrast, SDS, an anionic lipid-mimicking detergent, induced helical folding in the peptide at a concentration of approximately 0.003% (approximately 100 microM), approximately 70-fold below its typical CMC (0.17-0.23% or 6-8 mM). Both monomeric and tetrameric peptide can solubilize dimyristoylphosphatidylcholine (DMPC) liposomes and fold into approximately 60% alpha-helix. Fractionation by density gradient ultracentrifugation and visualization by negative staining electromicroscopy demonstrated that the peptide binds to DMPC with a high affinity to form at least two sizes of relatively homogeneous discoidal HDL-like particles depending on the initial lipid:peptide ratio. The characteristics (lipid:peptide weight ratio, diameter, and density) of both complexes are similar to those of plasma A-I/DMPC complexes formed under similar conditions: small discoidal complexes (approximately 3:1 weight ratio, approximately 110 A, and approximately 1.10 g/cm3) formed at an initial 1:1 weight ratio and larger discoidal complexes (approximately 4.6:1 weight ratio, approximately 165 A, and approximately 1.085 g/cm3) formed at initial 4:1 weight ratio. The cross-linking data for the peptide on the complexes of two sizes is consistent with the calculated peptide numbers per particle. Compared to the approximately 100 A disk-like complex formed by the N-terminal peptide in which helical structure was insufficient to cover the disk edge by a single belt, the compositions of these two types of complexes formed by the C-terminal peptide are more consistent with a "double belt" model, similar to that proposed for full-length apoA-I. Thus, our data provide direct evidence that this C-terminal region of apoA-I is responsible for the self-association of apoA-I, and this C-terminal peptide model can mimic the interaction with the phospholipid of plasma apoA-I to form two sizes of homogeneous discoidal complexes and thus may be responsible for apoA-I function in the formation and maintenance of HDL subspecies in plasma.
Figures
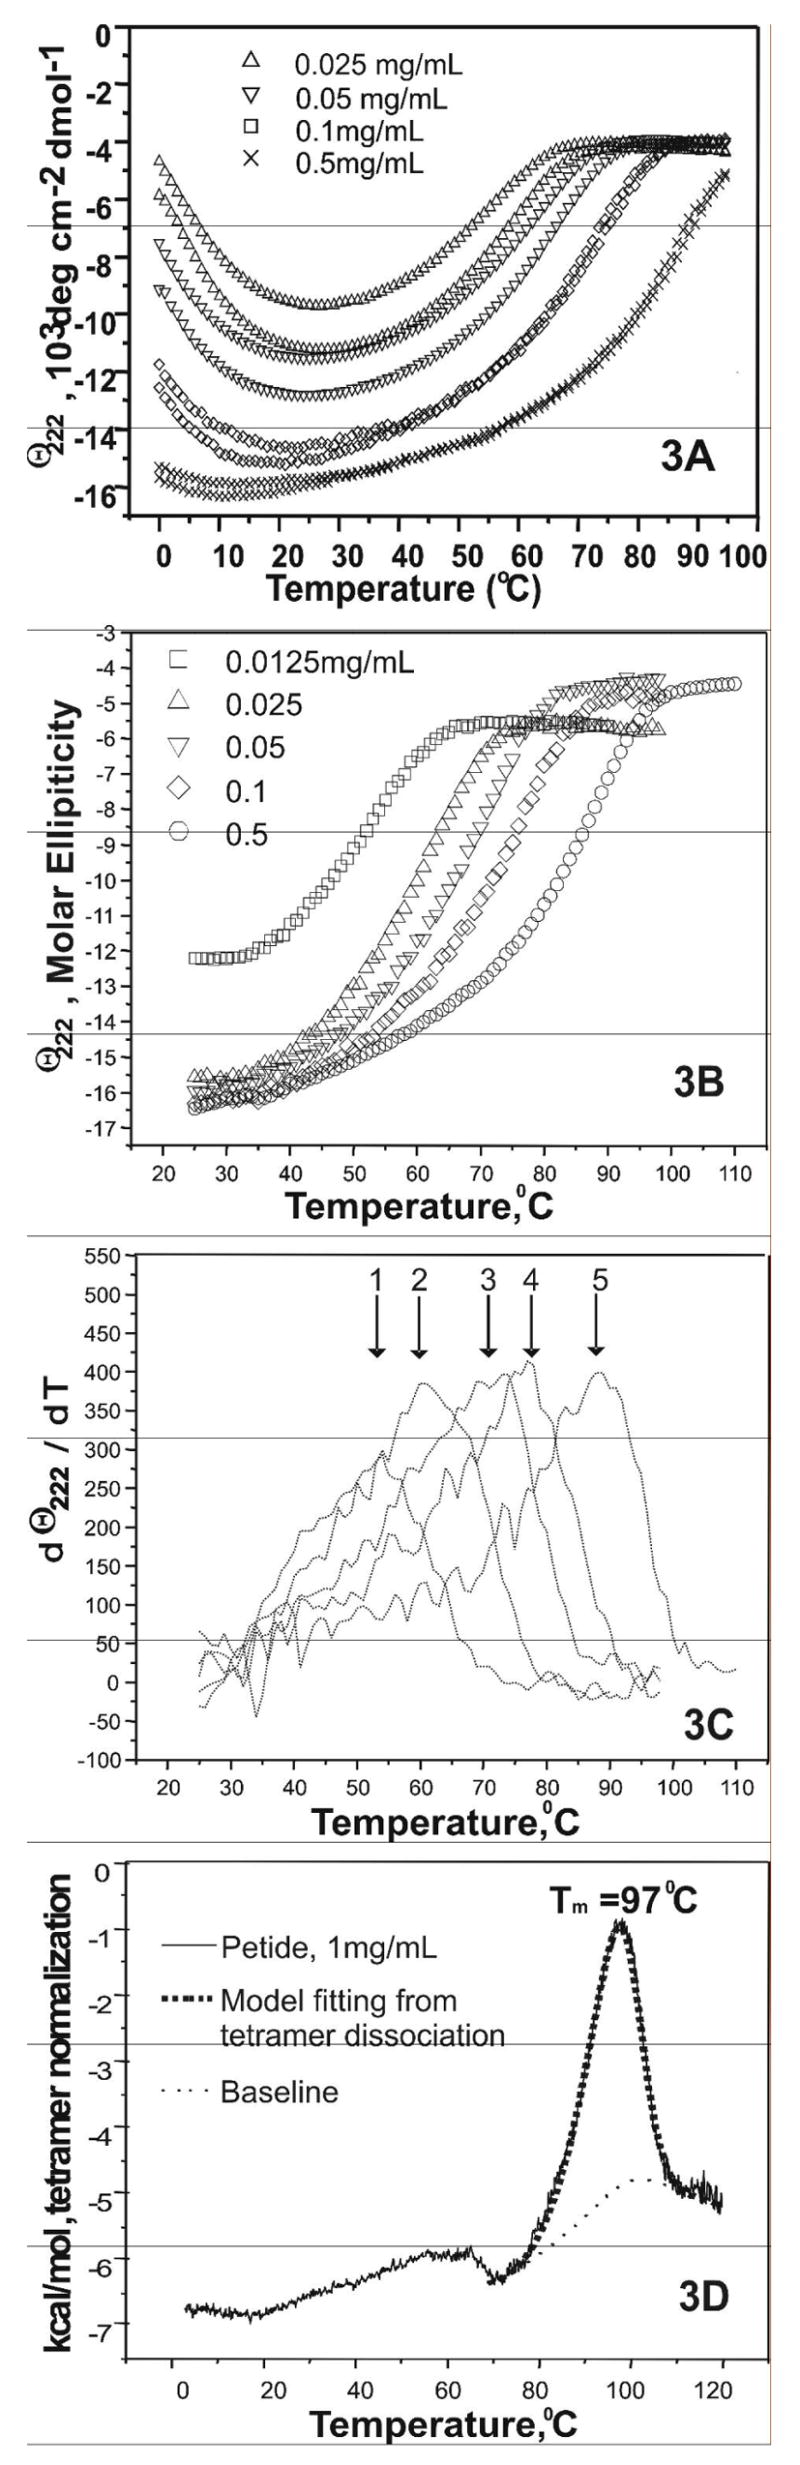
 ) fitting curve. Buffer line was subtracted. Only the larger peak at high temperature was analysized. The baseline was initiated according to the shape and further refined by the fitting model.
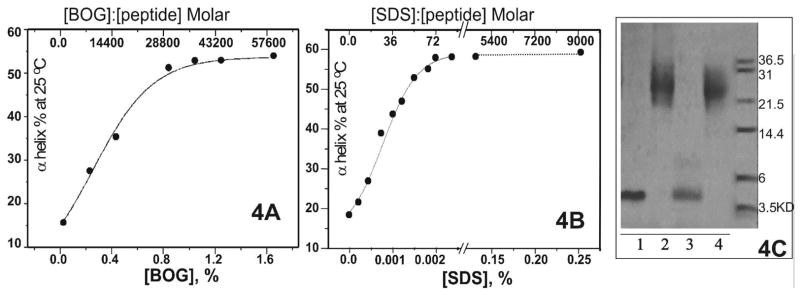
Similar articles
-
Conformation and lipid binding of the N-terminal (1-44) domain of human apolipoprotein A-I.Biochemistry. 2004 Oct 19;43(41):13156-64. doi: 10.1021/bi0487894. Biochemistry. 2004. PMID: 15476409
-
Association of synthetic peptide fragments of human apolipoprotein A-I with phospholipids.J Lipid Res. 1995 Aug;36(8):1686-96. J Lipid Res. 1995. PMID: 7595090
-
Lipid-free structure and stability of apolipoprotein A-I: probing the central region by mutation.Biochemistry. 2002 Aug 20;41(33):10529-39. doi: 10.1021/bi025807d. Biochemistry. 2002. PMID: 12173940
-
Apolipoprotein A-I: structure-function relationships.J Lipid Res. 2000 Jun;41(6):853-72. J Lipid Res. 2000. PMID: 10828078 Review.
-
High density lipoprotein structure-function and role in reverse cholesterol transport.Subcell Biochem. 2010;51:183-227. doi: 10.1007/978-90-481-8622-8_7. Subcell Biochem. 2010. PMID: 20213545 Free PMC article. Review.
Cited by
-
Physical analysis of recombinant forms of the human mitochondrial DNA helicase.Methods. 2010 Aug;51(4):411-5. doi: 10.1016/j.ymeth.2010.03.005. Epub 2010 Mar 25. Methods. 2010. PMID: 20347039 Free PMC article.
-
Single copies of Sec61 and TRAP associate with a nontranslating mammalian ribosome.Structure. 2008 Jul;16(7):1126-37. doi: 10.1016/j.str.2008.05.003. Structure. 2008. PMID: 18611385 Free PMC article.
-
The role of C-terminal ionic residues in self-association of apolipoprotein A-I.Biochim Biophys Acta Biomembr. 2023 Feb;1865(2):184098. doi: 10.1016/j.bbamem.2022.184098. Epub 2022 Dec 6. Biochim Biophys Acta Biomembr. 2023. PMID: 36481181 Free PMC article.
-
C-terminus of apolipoprotein A-I removes phospholipids from a triolein/phospholipids/water interface, but the N-terminus does not: a possible mechanism for nascent HDL assembly.Biophys J. 2011 Jul 20;101(2):353-61. doi: 10.1016/j.bpj.2011.03.055. Biophys J. 2011. PMID: 21767487 Free PMC article.
-
Interactions of apolipoprotein A-I with high-density lipoprotein particles.Biochemistry. 2013 Mar 19;52(11):1963-72. doi: 10.1021/bi400032y. Epub 2013 Mar 4. Biochemistry. 2013. PMID: 23425306 Free PMC article.
References
-
- Brouillette CG, et al. Structural models of human apolipoprotein A-I: a critical analysis and review. Biochim Biophys Acta. 2001;1531(1–2):4–46. - PubMed
-
- Gursky O. Apolipoprotein structure and dynamics. Curr Opin Lipidol. 2005;16(3):287–94. - PubMed
-
- Sorci-Thomas MG, Thomas MJ. The effects of altered apolipoprotein A-I structure on plasma HDL concentration. Trends Cardiovasc Med. 2002;12(3):121–8. - PubMed
-
- Sorci-Thomas MG, et al. Single repeat deletion in ApoA-I blocks cholesterol esterification and results in rapid catabolism of delta6 and wild-type ApoA-I in transgenic mice. J Biol Chem. 2000;275(16):12156–63. - PubMed
-
- Rogers DP, et al. Structural analysis of apolipoprotein A-I: effects of amino- and carboxy-terminal deletions on the lipid-free structure. Biochemistry. 1998;37(3):945–55. - PubMed
Publication types
MeSH terms
Substances
Grants and funding
LinkOut - more resources
Full Text Sources
