

Integrative analysis of a cancer somatic mutome
- PMID: 17280605
- PMCID: PMC1797053
- DOI: 10.1186/1476-4598-6-13
Integrative analysis of a cancer somatic mutome
Abstract
Background: The consecutive acquisition of genetic alterations characterizes neoplastic processes. As a consequence of these alterations, molecular interactions are reprogrammed in the context of highly connected and regulated cellular networks. The recent identification of the collection of somatically mutated genes in breast tumors (breast cancer somatic "mutome") allows the comprehensive study of its function and organization in complex networks.
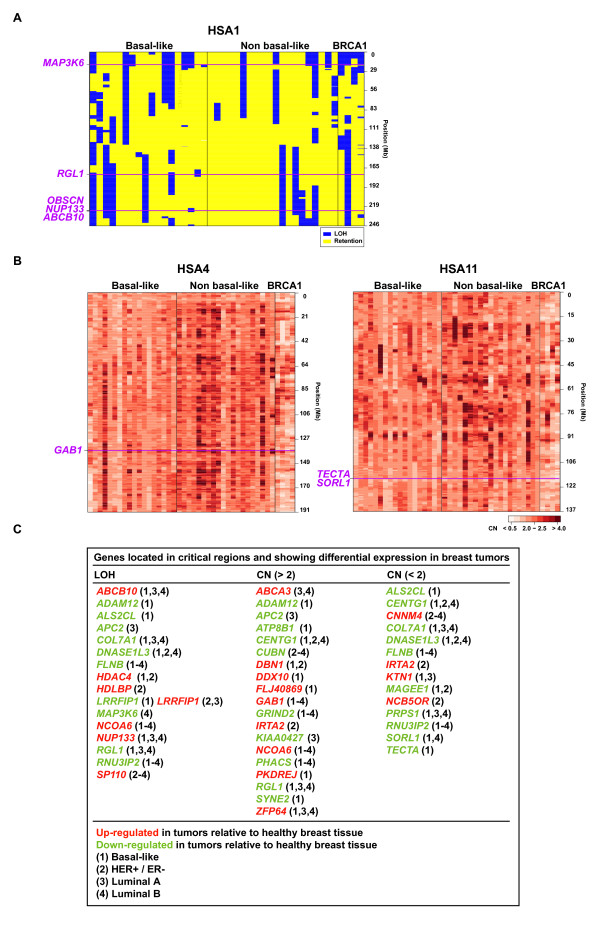
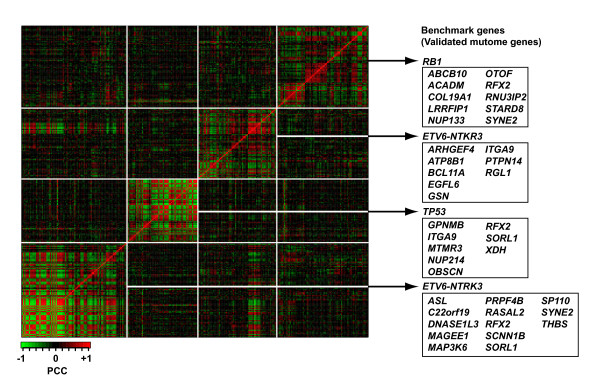
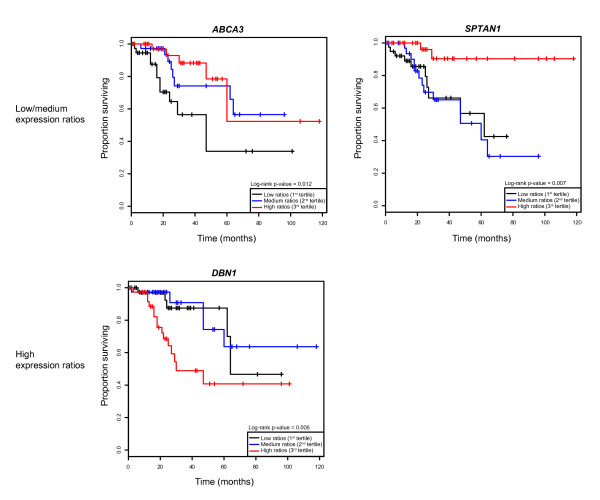
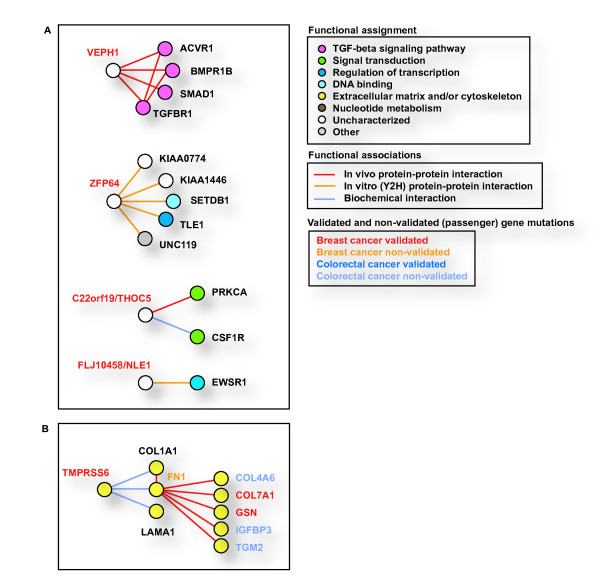
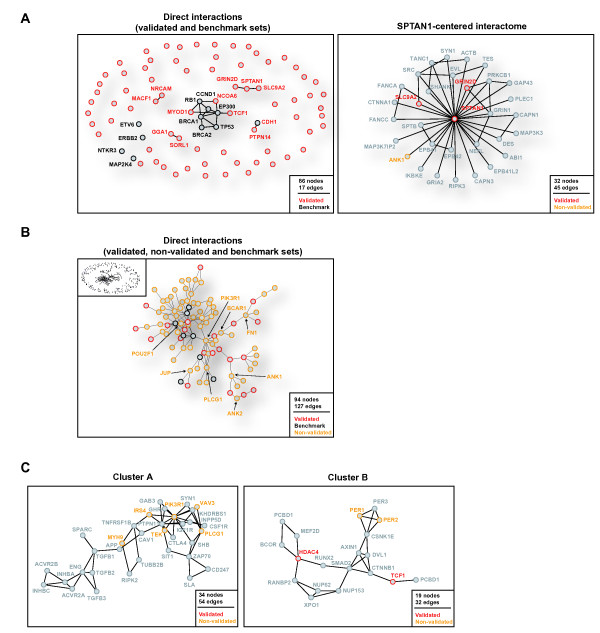
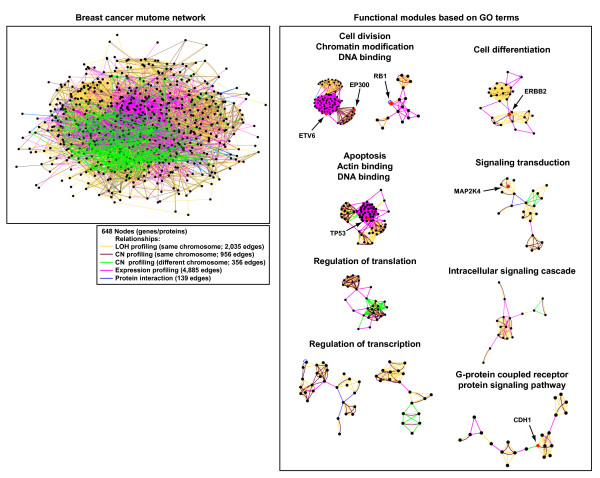
Results: We analyzed functional genomic data (loss of heterozygosity, copy number variation and gene expression in breast tumors) and protein binary interactions from public repositories to identify potential novel components of neoplastic processes, the functional relationships between them, and to examine their coordinated function in breast cancer pathogenesis. This analysis identified candidate tumor suppressors and oncogenes, and new genes whose expression level predicts survival rate in breast cancer patients. Mutome network modeling using different types of pathological and healthy functional relationships unveils functional modules significantly enriched in genes or proteins (genes/proteins) with related biological process Gene Ontology terms and containing known breast cancer-related genes/proteins.
Conclusion: This study presents a comprehensive analysis of the breast somatic mutome, highlighting those genes with a higher probability of playing a determinant role in tumorigenesis and better defining molecular interactions related to the neoplastic process.
Figures
Similar articles
-
DNA copy number alterations and expression of relevant genes in triple-negative breast cancer.Genes Chromosomes Cancer. 2008 Jun;47(6):490-9. doi: 10.1002/gcc.20550. Genes Chromosomes Cancer. 2008. PMID: 18314908
-
Targets of genome copy number reduction in primary breast cancers identified by integrative genomics.Genes Chromosomes Cancer. 2007 Mar;46(3):288-301. doi: 10.1002/gcc.20411. Genes Chromosomes Cancer. 2007. PMID: 17171680
-
Identification of genes with altered expression in medullary breast cancer vs. ductal breast cancer and normal breast epithelia.Int J Oncol. 2006 Jun;28(6):1327-35. Int J Oncol. 2006. PMID: 16685433
-
MicroRNA expression and its implications for the diagnosis and therapeutic strategies of breast cancer.Cancer Treat Rev. 2009 Jun;35(4):328-34. doi: 10.1016/j.ctrv.2008.12.002. Epub 2009 Jan 25. Cancer Treat Rev. 2009. PMID: 19171434 Review.
-
The genetics and genomics of cancer.Nat Genet. 2003 Mar;33 Suppl:238-44. doi: 10.1038/ng1107. Nat Genet. 2003. PMID: 12610533 Review.
Cited by
-
The Oct1 transcription factor and epithelial malignancies: Old protein learns new tricks.Biochim Biophys Acta. 2016 Jun;1859(6):792-804. doi: 10.1016/j.bbagrm.2016.02.007. Epub 2016 Feb 10. Biochim Biophys Acta. 2016. PMID: 26877236 Free PMC article. Review.
-
Candidate gene identification approach: progress and challenges.Int J Biol Sci. 2007 Oct 25;3(7):420-7. doi: 10.7150/ijbs.3.420. Int J Biol Sci. 2007. PMID: 17998950 Free PMC article. Review.
-
Identification of rare cancer driver mutations by network reconstruction.Genome Res. 2009 Sep;19(9):1570-8. doi: 10.1101/gr.092833.109. Epub 2009 Jul 2. Genome Res. 2009. PMID: 19574499 Free PMC article.
-
Pitfalls in experimental designs for characterizing the transcriptional, methylational and copy number changes of oncogenes and tumor suppressor genes.PLoS One. 2013;8(3):e58163. doi: 10.1371/journal.pone.0058163. Epub 2013 Mar 5. PLoS One. 2013. PMID: 23472150 Free PMC article.
-
A network of cancer genes with co-occurring and anti-co-occurring mutations.PLoS One. 2010 Oct 4;5(10):e13180. doi: 10.1371/journal.pone.0013180. PLoS One. 2010. PMID: 20957180 Free PMC article.
References
-
- Sjoblom T, Jones S, Wood LD, Parsons DW, Lin J, Barber TD, Mandelker D, Leary RJ, Ptak J, Silliman N, Szabo S, Buckhaults P, Farrell C, Meeh P, Markowitz SD, Willis J, Dawson D, Willson JK, Gazdar AF, Hartigan J, Wu L, Liu C, Parmigiani G, Park BH, Bachman KE, Papadopoulos N, Vogelstein B, Kinzler KW, Velculescu VE. The consensus coding sequences of human breast and colorectal cancers. Science. 2006;314:268–274. doi: 10.1126/science.1133427. - DOI - PubMed
Publication types
MeSH terms
Substances
Associated data
- Actions
LinkOut - more resources
Full Text Sources
Medical
Research Materials
