

Factor interaction analysis for chromosome 8 and DNA methylation alterations highlights innate immune response suppression and cytoskeletal changes in prostate cancer
- PMID: 17280610
- PMCID: PMC1797054
- DOI: 10.1186/1476-4598-6-14
Factor interaction analysis for chromosome 8 and DNA methylation alterations highlights innate immune response suppression and cytoskeletal changes in prostate cancer
Abstract
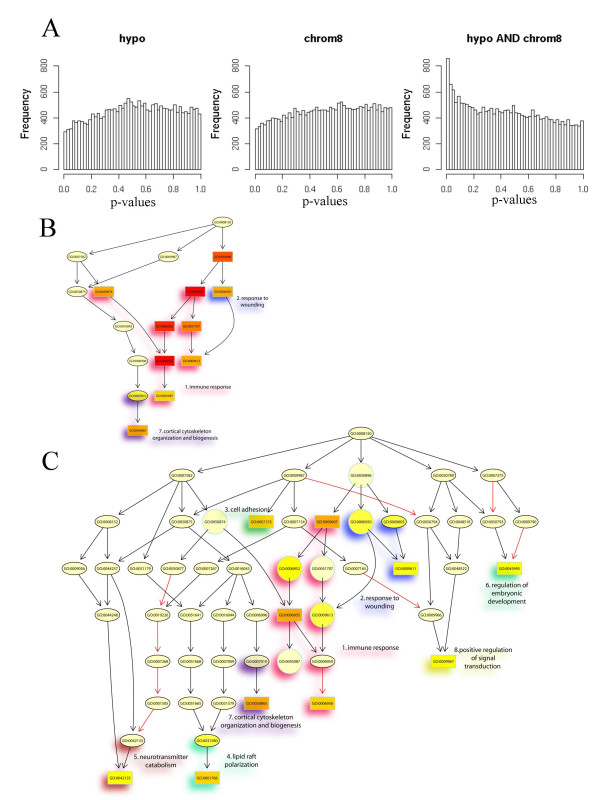
Background: Alterations of chromosome 8 and hypomethylation of LINE-1 retrotransposons are common alterations in advanced prostate carcinoma. In a former study including many metastatic cases, they strongly correlated with each other. To elucidate a possible interaction between the two alterations, we investigated their relationship in less advanced prostate cancers.
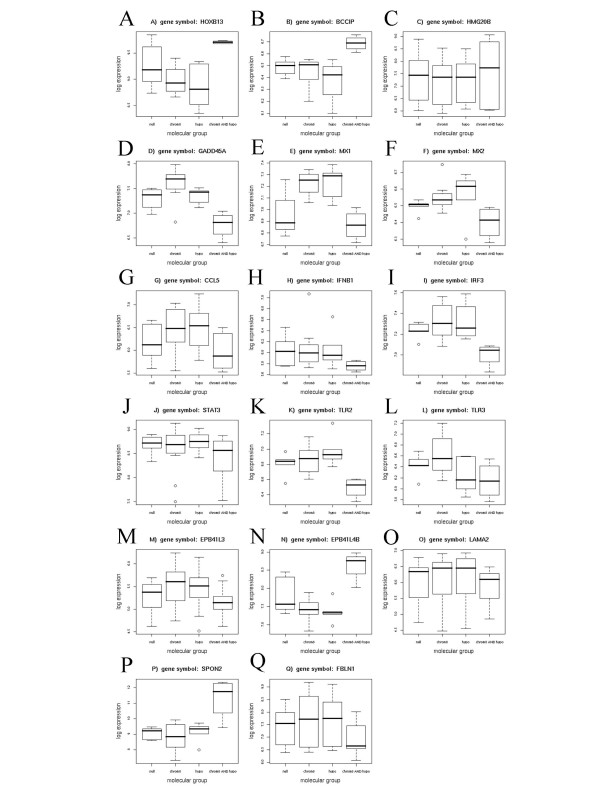
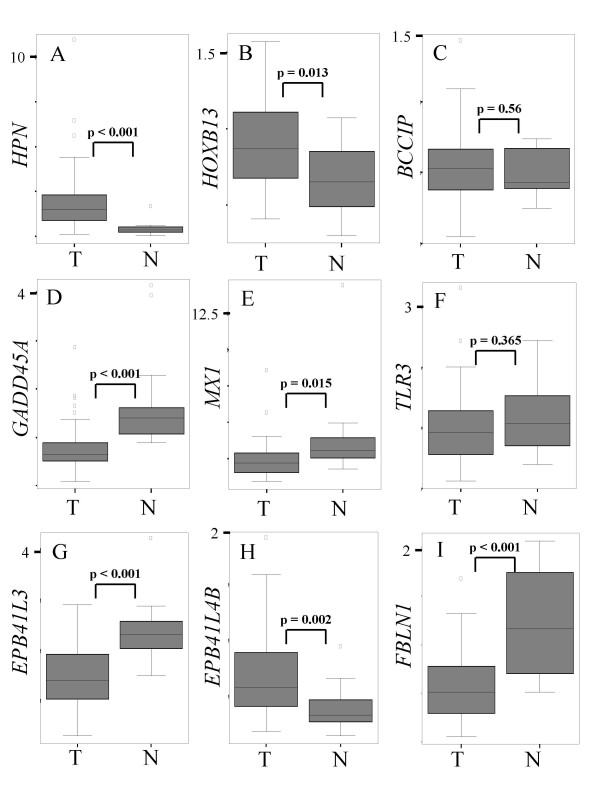
Results: In 50 primary tumor tissues, no correlation was observed between chromosome 8 alterations determined by comparative genomic hybridization and LINE-1 hypomethylation measured by Southern blot hybridization. The discrepancy towards the former study, which had been dominated by advanced stage cases, suggests that both alterations converge and interact during prostate cancer progression. Therefore, interaction analysis was performed on microarray-based expression profiles of cancers harboring both alterations, only one, or none. Application of a novel bioinformatic method identified Gene Ontology (GO) groups related to innate immunity, cytoskeletal organization and cell adhesion as common targets of both alterations. Many genes targeted by their interaction were involved in type I and II interferon signaling and several were functionally related to hereditary prostate cancer genes. In addition, the interaction appeared to influence a switch in the expression pattern of EPB41L genes encoding 4.1 cytoskeleton proteins. Real-time RT-PCR revealed GADD45A, MX1, EPB41L3/DAL1, and FBLN1 as generally downregulated in prostate cancer, whereas HOXB13 and EPB41L4B were upregulated. TLR3 was downregulated in a subset of the cases and associated with recurrence. Downregulation of EPB41L3, but not of GADD45A, was associated with promoter hypermethylation, which was detected in 79% of carcinoma samples.
Conclusion: Alterations of chromosome 8 and DNA hypomethylation in prostate cancer probably do not cause each other, but converge during progression. The present analysis implicates their interaction in innate immune response suppression and cytoskeletal changes during prostate cancer progression. The study thus highlights novel mechanisms in prostate cancer progression and identifies novel candidate genes for diagnostic and therapeutic purposes. In particular, TLR3 expression might be useful for prostate cancer prognosis and EPB41L3 hypermethylation for its detection.
Figures

Similar articles
-
Changes in cortical cytoskeletal and extracellular matrix gene expression in prostate cancer are related to oncogenic ERG deregulation.BMC Cancer. 2010 Sep 22;10:505. doi: 10.1186/1471-2407-10-505. BMC Cancer. 2010. PMID: 20860828 Free PMC article.
-
Genomewide DNA hypomethylation is associated with alterations on chromosome 8 in prostate carcinoma.Genes Chromosomes Cancer. 2002 Sep;35(1):58-65. doi: 10.1002/gcc.10092. Genes Chromosomes Cancer. 2002. PMID: 12203790
-
Hypermethylation of CpG island loci and hypomethylation of LINE-1 and Alu repeats in prostate adenocarcinoma and their relationship to clinicopathological features.J Pathol. 2007 Feb;211(3):269-77. doi: 10.1002/path.2106. J Pathol. 2007. PMID: 17139617
-
Involvement of the multiple tumor suppressor genes and 12-lipoxygenase in human prostate cancer. Therapeutic implications.Adv Exp Med Biol. 1997;407:41-53. doi: 10.1007/978-1-4899-1813-0_7. Adv Exp Med Biol. 1997. PMID: 9321930 Review.
-
Integrating biomedical knowledge to model pathways of prostate cancer progression.Cell Cycle. 2007 May 15;6(10):1177-87. doi: 10.4161/cc.6.10.4247. Epub 2007 May 5. Cell Cycle. 2007. PMID: 17495538 Review.
Cited by
-
Androgen receptor co-activators in the regulation of cellular events in prostate cancer.World J Urol. 2012 Jun;30(3):297-302. doi: 10.1007/s00345-011-0797-6. Epub 2011 Nov 22. World J Urol. 2012. PMID: 22105110 Review.
-
A New Combinatorial Optimization Approach for Integrated Feature Selection Using Different Datasets: A Prostate Cancer Transcriptomic Study.PLoS One. 2015 Jun 24;10(6):e0127702. doi: 10.1371/journal.pone.0127702. eCollection 2015. PLoS One. 2015. PMID: 26106884 Free PMC article.
-
DNA methylation at individual CpG-sites of EPB41L3, HTERT and FAM19A4 are useful for detection of cervical high-grade squamous intraepithelial lesions (HSIL) or worse: Analysis of individual CpG-sites outperforms averaging.Tumour Virus Res. 2024 Dec;18:200288. doi: 10.1016/j.tvr.2024.200288. Epub 2024 Jul 1. Tumour Virus Res. 2024. PMID: 38960143 Free PMC article.
-
TLR3 engagement induces IRF-3-dependent apoptosis in androgen-sensitive prostate cancer cells and inhibits tumour growth in vivo.J Cell Mol Med. 2015 Feb;19(2):327-39. doi: 10.1111/jcmm.12379. Epub 2014 Dec 2. J Cell Mol Med. 2015. PMID: 25444175 Free PMC article.
-
Characterization of DNA Methylation in Circulating Tumor Cells.Genes (Basel). 2015 Oct 21;6(4):1053-75. doi: 10.3390/genes6041053. Genes (Basel). 2015. PMID: 26506390 Free PMC article. Review.
References
-
- Macoska JA, Beheshti B, Rhim JS, Hukku B, Lehr J, Pienta KJ, Squire JA. Genetic characterization of immortalized human prostate epithelial cell cultures. Evidence for structural rearrangements of chromosome 8 and i(8q) chromosome formation in primary tumor-derived cells. Cancer Genet Cytogenet. 2000;120:50–57. doi: 10.1016/S0165-4608(99)00248-4. - DOI - PubMed
Publication types
MeSH terms
Substances
LinkOut - more resources
Full Text Sources
Other Literature Sources
Medical
Miscellaneous
