. 2007 Mar 30;367(3):665-80.
doi: 10.1016/j.jmb.2007.01.018. Epub 2007 Jan 12.

DNA-PK is involved in repairing a transient surge of DNA breaks induced by deceleration of DNA replication

Affiliations

DNA-PK is involved in repairing a transient surge of DNA breaks induced by deceleration of DNA replication

Tsutomu Shimura et al. J Mol Biol. .

Erratum in

  • J Mol Biol. 2007 Jul 27;370(5):1033. DiBernardi Maria A [corrected to DeBernardi, Maria A]

Abstract

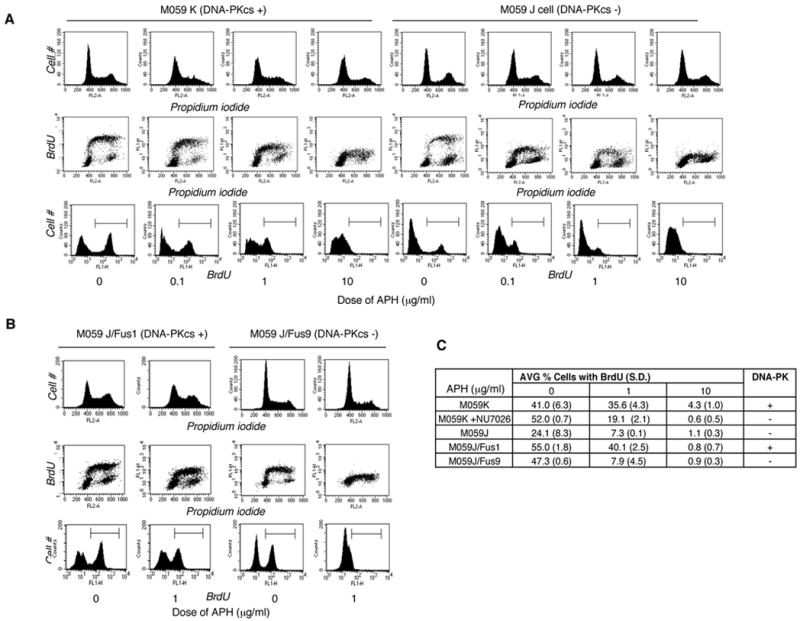
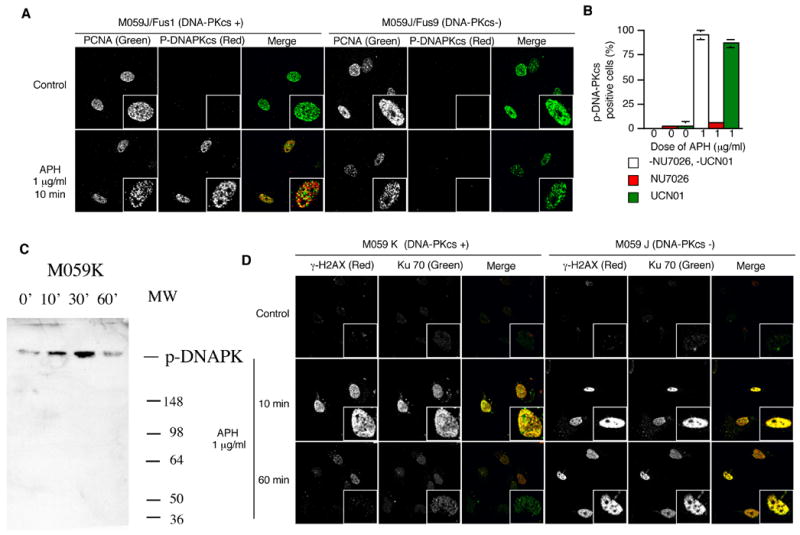
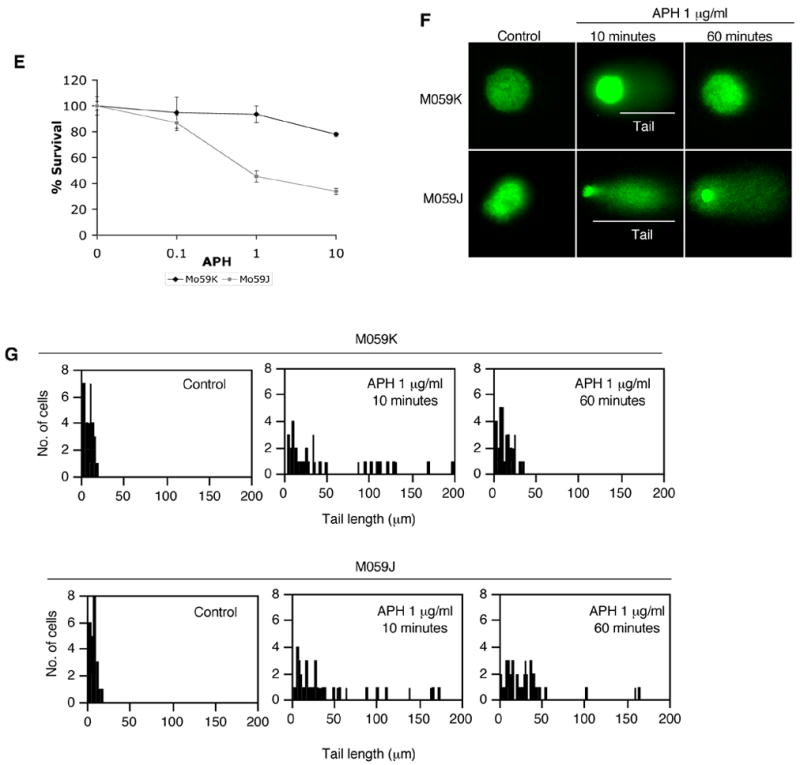
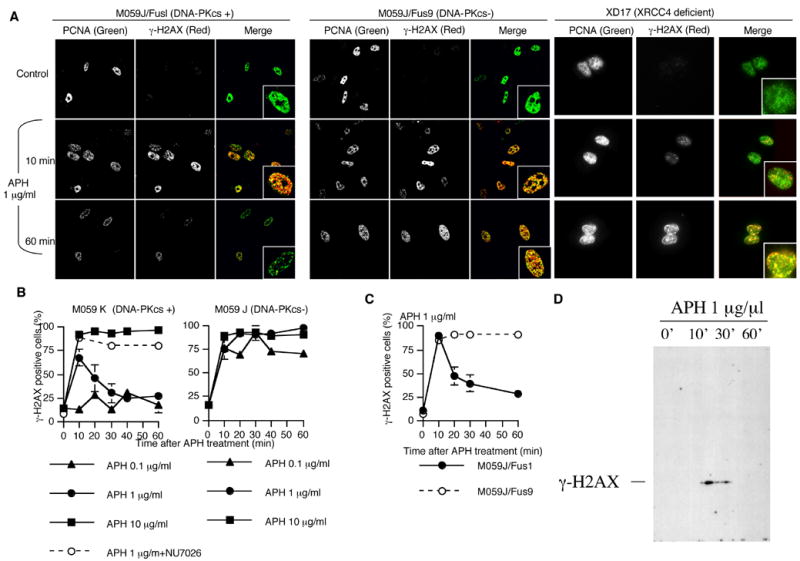
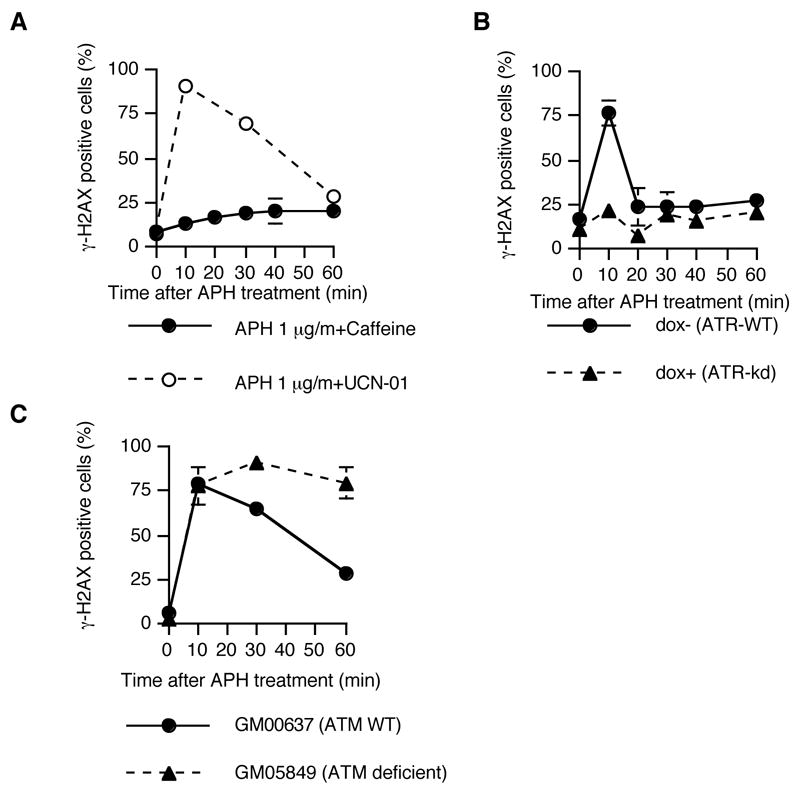
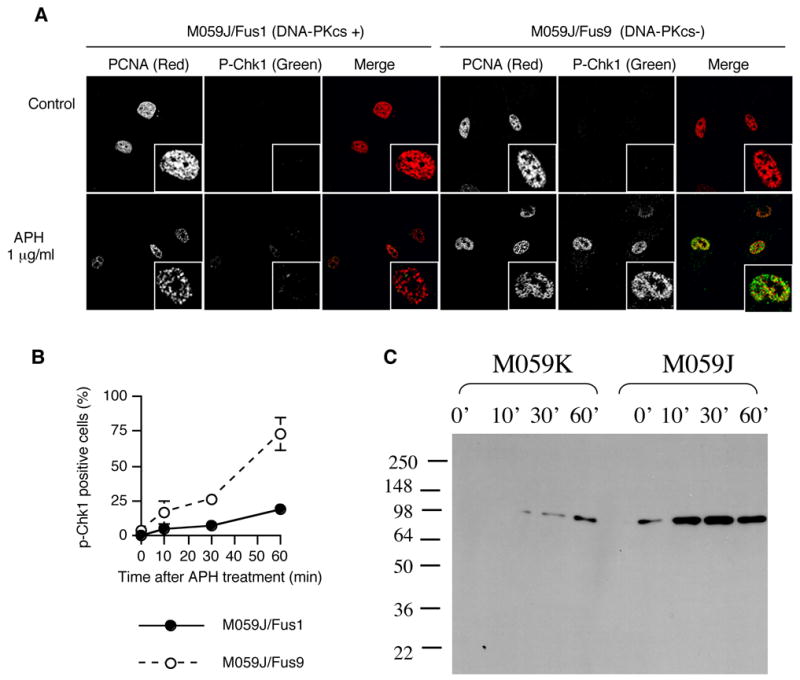
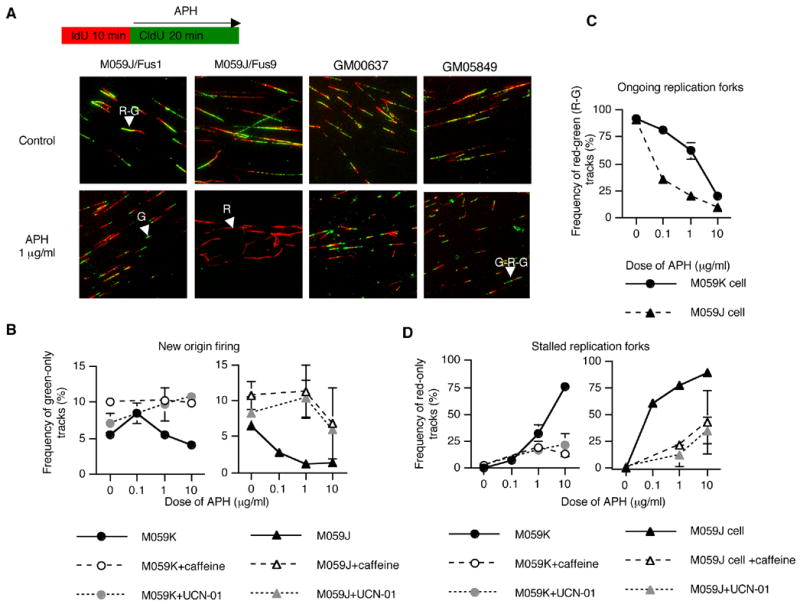
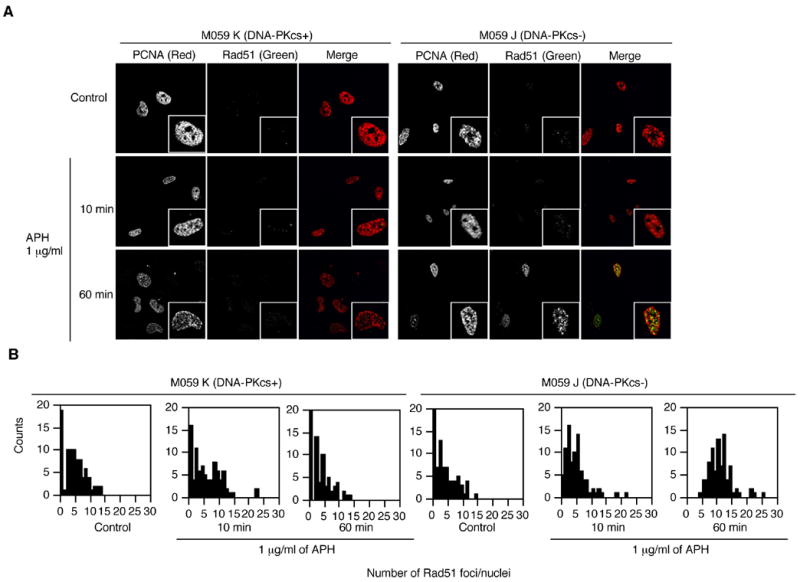
Cells that suffer substantial inhibition of DNA replication halt their cell cycle via a checkpoint response mediated by the PI3 kinases ATM and ATR. It is unclear how cells cope with milder replication insults, which are under the threshold for ATM and ATR activation. A third PI3 kinase, DNA-dependent protein kinase (DNA-PK), is also activated following replication inhibition, but the role DNA-PK might play in response to perturbed replication is unclear, since this kinase does not activate the signaling cascades involved in the S-phase checkpoint. Here we report that mild, transient drug-induced perturbation of DNA replication rapidly induced DNA breaks that promptly disappeared in cells that contained a functional DNA-PK whereas such breaks persisted in cells that were deficient in DNA-PK activity. After the initial transient burst of DNA breaks, cells with a functional DNA-PK did not halt replication and continued to synthesize DNA at a slow pace in the presence of replication inhibitors. In contrast, DNA-PK deficient cells subject to low levels of replication inhibition halted cell cycle progression via an ATR-mediated S-phase checkpoint. The ATM kinase was dispensable for the induction of the initial DNA breaks. These observations suggest that DNA-PK is involved in setting a high threshold for the ATR-Chk1-mediated S-phase checkpoint by promptly repairing DNA breaks that appear immediately following inhibition of DNA replication.


Figures

Figure 1
Figure 1
DNA synthesis after treatment with APH. (A) Cell cycle distribution after exposure of M059K and M059J cells to APH for 30 minutes. (B) Cell cycle distribution after exposure of M059J/Fus1 and M059J/Fus9 cells to APH for 30 minutes. The cell cycle distribution was determined by FACS. DNA content was determined by propidium iodide counterstaining and BrdU incorporation was detected with an anti-BrdU antibody (see Materials and Methods). (C) Average percentage of BrdU-positive cells in APH-treated M059K cells, M059K cells treated with 20 μM of the DNA-PK inhibitor Nu7026 30 minutes prior to exposure to APH, M059J cells, M059J/Fus1 and M059J/Fus9 cells. M059K cells have an active DNA-PK), M059J cells are derived from the same tumor as M059K but are deficient in DNA-PKcs, M059J/Fus1 are complemented with a copy of an active DNA-PKcs and M059J/Fus9 cells are M059J cells transfected with an empty vector and therefore, DNA-PKcs deficient. Experiments were repeated at least 3 times with independent samples. Standard deviations are shown in parentheses.
Figure 2
Figure 2
Phosphorylation of DNA-PK and formation of DSBs after treatment with low levels of APH. (A-C). Cells were treated with 1 μg/ml of APH for the indicated times and then immunostained with PCNA, p-DNA-PKcs, γ-H2AX, and Ku70. The images shown are from double staining experiments, but similar data were obtained with single staining with each antibody to control for possible “bleed through” between fluorescent channels. (A) Images of PCNA (green) and p-DNA-PKcs (red) in untreated cells and APH-treated cells. (B) The average percentage of p-DNA-PKcs positive, PCNA positive M059K cells after treatment with 1 μg/ml APH with and without NU7026 and UCN-01. 20 μM NU7026 and 300 nM UCN-01 were added in medium 30 minutes before APH treatment. We scored the number of p-DNA-PKcs-positive cells in 100 PCNA positive nuclei; the experiment was repeated 3 times with independent samples. Error bars indicate standard deviations. (C) Western blot analysis of nuclear proteins with M059K cells treated with APH at the indicated times and probed with an antibody against phosphorylated DNA-PK. (D) Images of γ-H2AX (red) and Ku70 (green) in untreated cells and APH-treated cells. Magnified images are inserted in (A) and (C). (E) colony forming assay of M059K and M059J cells after exposure to 1 μg/μl APH for 2 hours. (F–G) Double stranded DNA breaks formation after APH treatment evaluated by COMET assay. (F) Images of neutral comet assays after treatment with APH. (G) The distribution of tail length. For each data set, we scored 50 nuclei from two independent experiments.
Figure 2
Figure 2
Phosphorylation of DNA-PK and formation of DSBs after treatment with low levels of APH. (A-C). Cells were treated with 1 μg/ml of APH for the indicated times and then immunostained with PCNA, p-DNA-PKcs, γ-H2AX, and Ku70. The images shown are from double staining experiments, but similar data were obtained with single staining with each antibody to control for possible “bleed through” between fluorescent channels. (A) Images of PCNA (green) and p-DNA-PKcs (red) in untreated cells and APH-treated cells. (B) The average percentage of p-DNA-PKcs positive, PCNA positive M059K cells after treatment with 1 μg/ml APH with and without NU7026 and UCN-01. 20 μM NU7026 and 300 nM UCN-01 were added in medium 30 minutes before APH treatment. We scored the number of p-DNA-PKcs-positive cells in 100 PCNA positive nuclei; the experiment was repeated 3 times with independent samples. Error bars indicate standard deviations. (C) Western blot analysis of nuclear proteins with M059K cells treated with APH at the indicated times and probed with an antibody against phosphorylated DNA-PK. (D) Images of γ-H2AX (red) and Ku70 (green) in untreated cells and APH-treated cells. Magnified images are inserted in (A) and (C). (E) colony forming assay of M059K and M059J cells after exposure to 1 μg/μl APH for 2 hours. (F–G) Double stranded DNA breaks formation after APH treatment evaluated by COMET assay. (F) Images of neutral comet assays after treatment with APH. (G) The distribution of tail length. For each data set, we scored 50 nuclei from two independent experiments.
Figure 3
Figure 3
APH-induced γ-H2AX. Cells were treated with of the indicated doses of APH for the indicated times and then immunostained with PCNA and γ-H2AX. (A) Patterns of PCNA (green) and γ-H2AX (red) in untreated cells and in cells treated with 1 μg/ml APH. Magnified images are inserted. (B) The average percentage of γ-H2AX-positive cells in PCNA positive M059K and M059J cells. Empty circles: 20 μM Nu7026 was added 30 minutes before APH treatment. (C) Frequency of γ-H2AX-positive cells in PCNA positive M059J/Fus1 cells and M059J/Fus9 cells after treatment with 1 μg/ml of APH. For (B) and (C), we scored the number of γ-H2AX-positive cells in 100 nuclei of PCNA positive cells; the experiment was repeated 3 times with independent samples. Error bars represent standard deviations. (D) Western blot analysis of nuclear proteins from M059K cells treated with APH for the indicated times and probed with an antibody against γ–H2AX.
Figure 4
Figure 4
ATR-dependent phosphorylation of H2AX after treatment with APH. Cells were treated with 1 μg/ml of APH for the indicated times and then immunostained with PCNA and γ-H2AX. We scored the number of γ-H2AX-positive cells in 100 PCNA positive nuclei; the experiment was repeated 3 times with independent samples. (A) The frequency of γ-H2AX-positive cells that have PCNA in M059K cells after treatment with caffeine and UCN-01. 3mM caffeine and 300 nM UCN-01 were added 30 minutes before APH treatment. (B) The frequency of γ-H2AX-positive cells that have PCNA in ATRkd cells. To activate the ATRkd, cells were pretreated with 2μg/ml doxycycline for 2 days. (C) The frequency of γ-H2AX-positive cells in human fibroblasts that contain wild-type ATM (GM00637) and fibroblasts that are deficient in ATM (GM05849). Error bars represent standard deviations.
Figure 5
Figure 5
Checkpoint activation after treatment with APH. Cells were treated the indicated doses of APH for the indicated times and then immunostained with PCNA and p-Chk1 (serine 317). (A) Images of PCNA (red) and p-Chk1 (green) in untreated cells and cells treated with 1 μg/ml of APH. Magnified images are inserted. (B) The frequency of p-Chk1-positive cells in PCNA positive M059J/Fus1 and M059J/Fus cells treated with 10 μg/ml APH. We scored the number of p-Chk1 positive cells in 100 nuclei of cells with PCNA; the experiment was repeated 3 times with independent samples. Error bars represent standard deviations. (C) Western blot analysis of nuclear proteins from M059K and M059J cells treated with APH for the indicated times and probed with antibodies against phosphorylated Chk1.
Figure 6
Figure 6
Suppression of origin firing and stalled replication forks after treatment with APH. The rate of replication fork progression in M059J/Fus1 (cells with an active DNA-PK), M059J/Fus9 cells (DNA-PKcs deficient), GM00637 (cells containing wild-type ATM) and GM05849 (cells deficient in ATM) was measured by a DNA fiber assay. Cells were first labeled with IdU for 10 minutes. IdU was then washed out and the cells were exposed to APH concomitant with the addition CldU for 20 min. IdU was immunodetected by Cy-3–labeled antibodies (red color; see Material and Methods). CldU was detected by Alexa488-labeled antibodies (green color). (A) Images of labeled tracks. Red-green tracks (R-G), red-only tracks (R), green-only tracks (G), and green-red-green tracks (G-R-G) are indicated by arrowheads. (B) Abundance of G tracks in M059J and M059J cells (green tracks represent new origin firing). (C) Abundance of R-G tracks (ongoing replication forks). (D) Abundance of R tracks (stalled replication forks). 3mM caffeine and 300 nM UCN-01 were added 30 minutes before APH treatment. For each data point, we counted 100 tracks. Each experiment was repeated twice from independent DNA preparations. Error bars represent standard deviations.
Figure 7
Figure 7
Rad51 patterns after treatment with APH. Cells were treated with 1 μg/ml of APH for the indicated time and then immunostained with PCNA and Rad51. (A) Images of PCNA (red) and Rad51 (green) in untreated cells and in cells treated with 1 μg/ml APH. Magnified images are inserted. (B) The distribution of Rad51 foci after treatment with APH in M059K and M059J cells. We scored the number of Rad51 foci in 30 PCNA positive nuclei. The experiments were repeated 3 times with independent samples.

Similar articles

Cited by

References

    1. Yang J, Yu Y, Hamrick HE, Duerksen-Hughes PJ. ATM, ATR and DNA-PK: initiators of the cellular genotoxic stress responses. Carcinogenesis. 2003;24:1571–80. - PubMed
    1. Durocher D, Jackson SP. DNA-PK, ATM and ATR as sensors of DNA damage: variations on a theme? Curr Opin Cell Biol. 2001;13:225–31. - PubMed
    1. Gottifredi V, Prives C. The S phase checkpoint: when the crowd meets at the fork. Semin Cell Dev Biol. 2005;16:355–68. - PubMed
    1. Osborn AJ, Elledge SJ, Zou L. Checking on the fork: the DNA-replication stress-response pathway. Trends Cell Biol. 2002;12:509–16. - PubMed
    1. Bartek J, Lukas C, Lukas J. Checking on DNA damage in S phase. Nat Rev Mol Cell Biol. 2004;5:792–804. - PubMed

Publication types