. 2007 Apr;27(8):2870-85.
doi: 10.1128/MCB.02323-06. Epub 2007 Feb 5.

A modular enhancer is differentially regulated by GATA and NFAT elements that direct different tissue-specific patterns of nucleosome positioning and inducible chromatin remodeling

Affiliations

A modular enhancer is differentially regulated by GATA and NFAT elements that direct different tissue-specific patterns of nucleosome positioning and inducible chromatin remodeling

Andrew G Bert et al. Mol Cell Biol. 2007 Apr.

Abstract

We investigated alternate mechanisms employed by enhancers to position and remodel nucleosomes and activate tissue-specific genes in divergent cell types. We demonstrated that the granulocyte-macrophage colony-stimulating factor (GM-CSF) gene enhancer is modular and recruits different sets of transcription factors in T cells and myeloid cells. The enhancer recruited distinct inducible tissue-specific enhanceosome-like complexes and directed nucleosomes to different positions in these cell types. In undifferentiated T cells, the enhancer was activated by inducible binding of two NFAT/AP-1 complexes which disrupted two specifically positioned nucleosomes (N1 and N2). In myeloid cells, the enhancer was remodeled by GATA factors which constitutively displaced an upstream nucleosome (N0) and cooperated with inducible AP-1 elements to activate transcription. In mast cells, which express both GATA-2 and NFAT, these two pathways combined to activate the enhancer and generate high-level gene expression. At least 5 kb of the GM-CSF locus was organized as an array of nucleosomes with fixed positions, but the enhancer adopted different nucleosome positions in T cells and mast cells. Furthermore, nucleosomes located between the enhancer and promoter were mobilized upon activation in an enhancer-dependent manner. These studies reveal that distinct tissue-specific mechanisms can be used either alternately or in combination to activate the same enhancer.


Figures
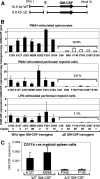
FIG. 1.
FIG. 1.
GM-CSF expression in GM-CSF transgenic mice. (A) GM-CSF transgenes with and without the enhancer. WT, wild type. (B) ELISAs of human GM-CSF expression expressed relative to mouse GM-CSF expression, divided by transgene copy number and multiplied by 2 to correct for mouse GM-CSF copy number. GM-CSF was measured in culture supernatants from splenocytes and peritoneal myeloid cells stimulated for 15 h with 20 ng/ml PMA and 1 μM A23187 (PMA/I) or 10 μg/ml LPS. Transgene copy numbers are displayed below. Black bars depict wild-type transgenes, and open bars depict transgenes lacking the enhancer. Error bars represent standard error (SE). (C) Human GM-CSF mRNA expression in CD11b-positive GM-CSF transgenic splenocytes stimulated for 4 h with 20 ng/ml PMA and 2 μM A23187. mRNA expression was measured by real-time PCR of cDNA and is expressed relative to mouse GAPDH expression and corrected for transgene copy number. Error bars represent SE. +ve, positive.
FIG. 2.
FIG. 2.
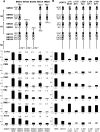
GATA-2 binding at the human GM-CSF enhancer. (A) Map of the GM-CSF enhancer showing previously defined transcription factor binding sites plus predicted Ets and GATA sites. The sequence is numbered relative to the BglII site defining the 5′ boundary of the enhancer. Brackets indicate the defined composite NFAT/AP-1 binding sites located at 170, 330, 420, and 550 bp relative to the 5′ BglII site. The positions of specific defined nucleosomes as measured in T cells are shown above. Depicted underneath are the blocks of conserved sequences displayed in panels B and C and the conserved core region that is required for enhancer function in T cells. (B) Alignment of the human GM-CSF enhancer sequence from positions 110 to 176 bp (relative to the 5′ BglII site) with homologous sequences in the chimpanzee, rhesus monkey, dog, mouse, rat, cow, and rabbit genomes. The Ets-1-like sequence and at least one of the two GATA elements are conserved in all species presented. Each of the GATA elements and the GM170 AP-1 site are all conserved in primates, but not in other species. Highly conserved predicted regulatory elements are shown in boldface. The underlined sequences depict a Runx1-like element that exists in place of the AP-1 site in some species. (C) Alignment of the sequence from bp 209 to 255 of the human GM-CSF enhancer with the mouse, rat, and dog genomic sequences shows conservation of the NF-κB and NFAT-like elements in this region. (D) EMSAs of GATA elements within the GM-CSF enhancer and promoter, performed with 5 μg of K562 nuclear extract and 0.2 ng of probe, in the presence and absence of 20 ng of oligonucleotide duplex competitor, in the form of either the GATA consensus sequence (labeled C) or the GM138 or GM153 GATA sequences. (E) EMSAs performed as in panel D using nuclear extracts from the indicated cell lines, in the presence and absence of the GATA consensus competitor. (F) EMSAs of Sp1 sites in the GM-CSF enhancer and promoter, assayed in parallel with a consensus Sp1 sequence. ns, nonspecific complex.
FIG. 3.
FIG. 3.
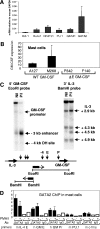
Characterization of mouse mast cells. (A) Real-time PCR analysis of mouse transcription factor mRNA expression in mast cells. PCRs were performed on mast cell cDNA, and mRNA levels were expressed relative to mouse GAPDH as in Fig. 1. Note that all of the tissue-specific transcription factors measured here are expressed in levels greater than that of the ubiquitous transcription factor Oct1A. (B) Human GM-CSF mRNA expression in GM-CSF transgenic mast cells stimulated for 4 h with 20 ng/ml PMA and 2 μM A23187. mRNA expression was measured by real-time PCR of cDNA and is expressed relative to mouse GAPDH expression and corrected for transgene copy number. Error bars represent standard deviation. WT, wild type. (C) Analysis of DH sites within the enhancer (E) and promoter (P) upstream of the GM-CSF gene. DNase I digestions were performed on permeabilized mast cells grown from bone marrow obtained from line C42 transgenic mice carrying the intact IL-3/GM-CSF locus. Cells were either unstimulated (nil) or stimulated for 4 h with 20 ng/ml PMA and 2 μM A23187 (P/I). Mapping of DH sites was performed from the indicated EcoRI or BamHI sites using the probes depicted by boxes, as previously described (11). The BamHI probe was used to detect a cluster of ubiquitous constitutive and inducible DH sites (11) so as to control for the extent of DNase I digestion, and the samples analyzed here represent just the optimum digestion points selected from a DNase I titration series. (D) ChIP assays of GATA-2 binding in M268 transgenic mast cells at the GM-CSF enhancer (GME) and promoter (GM Pr). Columns represent the amount of genomic DNA precipitated using a polyclonal GATA-2 antibody (black bars) or a normal rabbit IgG (open bars) from chromatin prepared from unstimulated cells (−) and cells stimulated for 4 h with 20 ng/ml PMA and 2 μM A23187 (+). Values are expressed relative to an inactive control region located on mouse chromosome 1. mIL-4 E depicts the mouse IL-4 intron 2 enhancer, which binds GATA-2, whereas mouse (m) PU.1 and c-fms are negative control amplicons, as detailed in Materials and Methods. Error bars indicate standard deviation.
FIG. 4.
FIG. 4.
The GM-CSF enhancer is composed of distinct tissue-specific modules. GM-CSF enhancer deletions and mutations were assayed in transient transfection assays. Cells were transfected with 5 μg of DNA, cultured for a further 20 h, and then stimulated for 9 h with 20 ng/ml PMA and 2 μM A23187. Constructs were based on the human GM-CSF promoter/luciferase gene plasmid pXPG-GM627 and contain the 717-bp BglII segment of the GM-CSF enhancer (GME) (pXPG-GM627-B717) with or without point mutations, or the indicated subsegments of the enhancer, inserted upstream of the promoter (21). Enhancer subfragments (A) and enhancer mutations (B) were assayed separately. Values in panel A are expressed relative to BM575, with the increase (fold) over the promoter alone displayed above each column, and values in panel B are expressed relative to GME. Each column represents the average of transfections of at least two independent clones of each construct. The numbers of individual transfections are displayed under each column, and error bars represent standard error. ND, not determined.
FIG. 5.
FIG. 5.
Mast cells and T cells adopt a different chromatin architecture at the GM-CSF enhancer. Analysis of nuclease sensitivity within the GM-CSF enhancer by Southern blot hybridization. (A) DH sites were assayed by indirect end labeling from the 3′ PshA I site, using the probe depicted in panel B, in the indicated cells and cell lines before (−) and after (+) stimulation with 20 ng/ml PMA and 2 μM A23187 for 4 to 6 h. The restriction enzyme (RE) ladder is a mixture of PshAI-digested genomic DNA samples, also digested with either PstI, ApaI, or HindIII or partially digested with BglII. (B) Map of the GM-CSF enhancer region (open box) depicting the PshAI-HindIII and BglII-BglI probes used for mapping in panels A and C. (C) DH sites and MNase sites were assayed in cultured splenic T cells (T) and bone marrow-derived mast cells (M) from the human GM-CSF transgenic line M268, before (nil) and after (P/I) stimulation with 20 ng/ml PMA and 2 μM A23187 for 4 h. For DNase I digestions of stimulated cells, the right-hand lane of each pair represents a higher concentration of DNase I. Cleavage sites were mapped from the 3′ BglI site using the probes depicted in panel B. Numbers to the right indicated the positions of major MNase bands relative to the 5′ BglII site. The first lane (DNA) represents genomic DNA. The last lane (control) represents genomic DNA digested with MNase. (D) Graphs of either actual DNase I cleavage (top two traces) or relative MNase cleavage (bottom four traces) detected in BglI-digested samples in panel C plotted according to the positions of cleavage sites relative to the 5′ BglII site. Relative MNase cleavage was calculated by dividing the intensity of signal at each point by the signal obtained for the control MNase digest at the same point. Regions where there is evidence for protection from nuclease cleavage are shown as boxes above the panel, together with the positions of these protected regions and a prediction of factors that may be bound at these sites (N, NFAT; A, AP-1; G, GATA-2; and κB, NF-κB). Nucleosome positions predicted from the graphs are indicated below. (E) Graphs derived from Fig. 6A of relative MNase cleavage within the enhancer detected in PshAI-digested samples probed from the upstream probe (B).
FIG. 6.
FIG. 6.
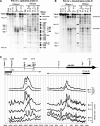
Long-range nucleosomal organization and chromatin structure in the GM-CSF locus in mast cells and T cells. (A and B) Analyses of nuclease sensitivity within the GM-CSF enhancer using the same samples and methodology presented in Fig. 5C. These analyses employed upstream and downstream probes to detect cleavage sites relative to the PshAI sites as depicted in panel C. In panel A, the numbers to the right refer to positions relative to the GM-CSF enhancer 5′ BglII site. (C) Map of the GM-CSF locus depicting the PshAI sites and probes used to map cleavage sites in panels A and B. Numbers above the map indicate positions relative to the transcription start site, and numbers below indicate positions relative to the GM-CSF enhancer 5′ BglII site. The graphs below the map are as in Fig. 5D and represent the limits of mapping data obtained using either the upstream or downstream probes. The positions of the GATA sites are indicated by arrows labeled G. The asterisks indicate MNase sites that may reflect an alternate phasing of nucleosomes.
FIG. 7.
FIG. 7.
Nucleosome destabilization and mobilization in the GM-CSF locus in mast cells and T cells. (A to F) Southern blot hybridization analysis of DNA purified from MNase-digested nuclei isolated from M268 GM-CSF transgenic mouse mast cells and T cells that were either unstimulated (0) or stimulated for 4 h with 20 ng/ml PMA and 2 μM A23187 (P/I). Each pair of MNase digestion conditions employed increasing concentrations of MNase digested within the range of 50 to 500 U/ml for 3 or 15 min using the probes depicted in panel F. (A) MNase digestion of bulk chromatin as detected by ethidium bromide staining, including the HaeIII φX174 marker used to determine sizes of oligonucleosome fragments. (B to E) Hybridization patterns obtained with the indicated probes. The left-hand lanes in each panel represent genomic DNA digested with PstI, ApaI, and BglII to produce fragments used to confirm appropriate hybridization specificity and validate quantification of size estimations. (F) Map of the GM-CSF transgene showing the locations of hybridization probes. Summarized below each probe are the average nucleosome repeat lengths determined from densitometry of the images in panels A to F. (G) MNase analyses of M268 and F140 transgenic T cells performed as described above, using 150 U/ml MNase for 15 min, and the −1.3-kb probe. F140 contains a transgene lacking the GM-CSF enhancer, as in Fig. 1A.
FIG. 8.
FIG. 8.
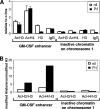
ChIP assays of histones in mast cells. (A) Assays of acetyl K9 histone H3, pan-acetyl H4, unmodified histone H3, or control IgG, using real-time PCR primers located within the GM-CSF enhancer or an inactive control region on chromosome 1. Mast cells were prepared from line C42 transgenic mice and were either unstimulated (nil) or stimulated for 4 h with 20 ng/ml PMA and 2 μM A23187 (P/I). All values represent duplicate ChIP assays with error bars showing standard deviation and have been normalized to ChIP data obtained with the inactive c-fms locus. (B) Ratios of acetyl K9 H3 to unmodified H3 ChIP values.
FIG. 9.
FIG. 9.
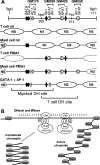
Anatomy of a DH site. (A) Models of nucleosome reorganization and transcription factor recruitment in the GM-CSF enhancer. Each line below the map summarizes the predicted positions of nucleosomes and recruited transcription factors under different conditions. Large solid ovals represent specifically positioned nucleosomes. Dotted ovals indicate positions where nucleosomes adopt flexible positions. nil, unstimulated. (B) Scale model of enhanceosomes and nucleosomes within the activated GM-CSF enhancer in T cells.

References

    1. Avots, A., M. Buttmann, S. Chuvpilo, C. Escher, U. Smola, A. J. Bannister, U. R. Rapp, T. Kouzarides, and E. Serfling. 1999. CBP/p300 integrates Raf/Rac-signaling pathways in the transcriptional induction of NF-ATc during T cell activation. Immunity 10:515-524. - PubMed
    1. Baxter, E. W., W. J. Cummings, and R. E. Fournier. 2005. Formation of a large, complex domain of histone hyperacetylation at human 14q32.1 requires the serpin locus control region. Nucleic Acids Res. 33:3313-3322. - PMC - PubMed
    1. Bert, A. G., J. Burrows, A. Hawwari, M. A. Vadas, and P. N. Cockerill. 2000. Reconstitution of T cell-specific transcription directed by composite NFAT/Oct elements. J. Immunol. 165:5646-5655. - PubMed
    1. Butterfield, J. H., and D. A. Weiler. 1989. In vitro sensitivity of immature human mast cells to chemotherapeutic agents. Int. Arch. Allergy Appl. Immunol. 89:297-300. - PubMed
    1. Carey, M. 1998. The enhanceosome and transcriptional synergy. Cell 92:5-8. - PubMed

Publication types

MeSH terms

Substances

LinkOut - more resources