. 2007 Apr;27(8):3241-52.
doi: 10.1128/MCB.00072-07. Epub 2007 Feb 5.

Fibrocystin/polyductin, found in the same protein complex with polycystin-2, regulates calcium responses in kidney epithelia

Affiliations

Fibrocystin/polyductin, found in the same protein complex with polycystin-2, regulates calcium responses in kidney epithelia

Shixuan Wang et al. Mol Cell Biol. 2007 Apr.

Abstract

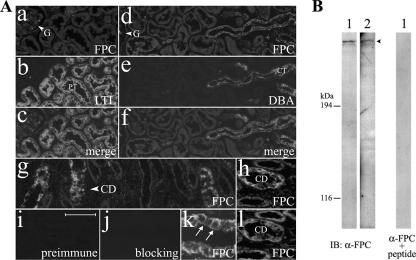
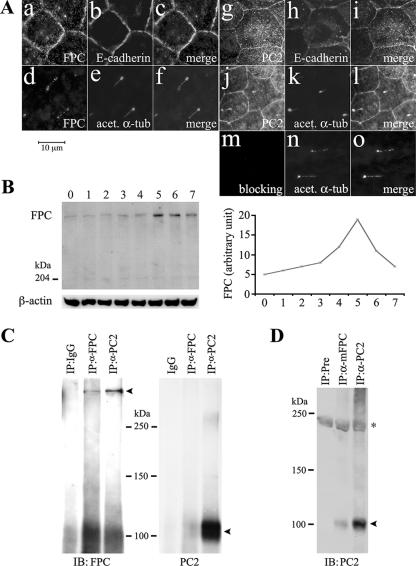
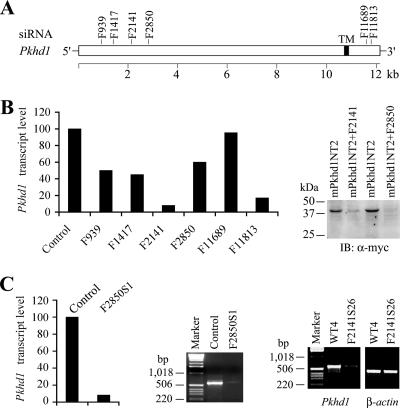
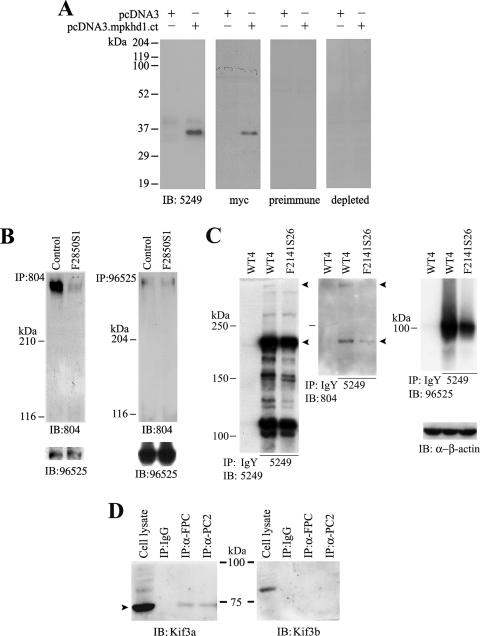
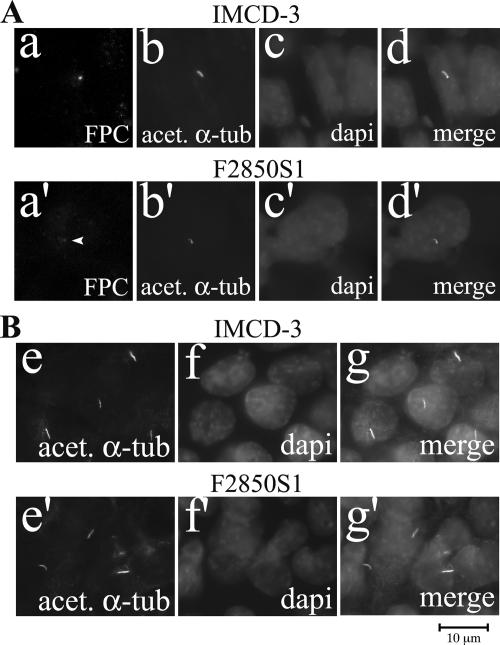
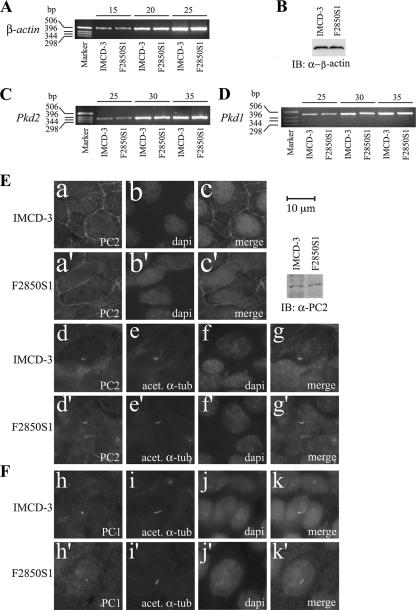
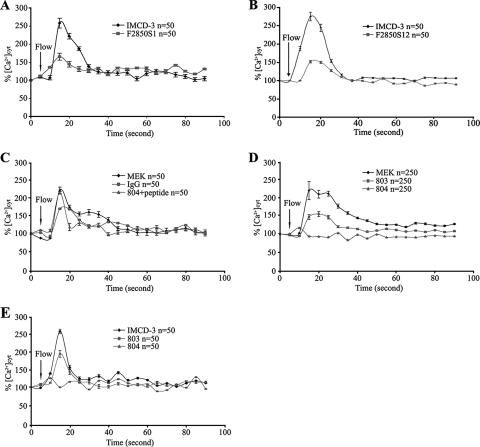
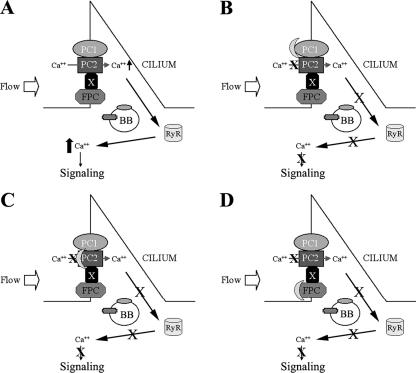
Recent evidence suggests that fibrocystin/polyductin (FPC), polycystin-1 (PC1), and polycystin-2 (PC2) are all localized at the plasma membrane and the primary cilium, where PC1 and PC2 contribute to fluid flow sensation and may function in the same mechanotransduction pathways. To further define the exact subcellular localization of FPC, the protein product encoded by the PKHD1 gene responsible for autosomal recessive polycystic kidney disease (PKD) in humans, and whether FPC has direct and/or indirect cross talk with PC2, which, in turn, is pivotal for the pathogenesis of autosomal dominant PKD, we performed double immunostaining and coimmunoprecipitation as well as a microfluorimetry study of kidney tubular epithelial cells. FPC and PC2 are found to completely or partially colocalize at the plasma membrane and the primary cilium and can be reciprocally coimmunoprecipitated. Although incomplete removal of FPC by small interfering RNA and antibody 803 to intracellular epitopes of FPC did not abolish flow-induced intracellular calcium responses, antibody 804 to extracellular epitopes of FPC blocked cellular calcium responses to flow stimulation. These findings suggest that FPC and polycystins share, at least in part, a common mechanotransduction pathway.


Figures

FIG. 1.
FIG. 1.
FPC is detectable at the apical and basolateral domains of the plasma membrane in human adult kidneys. (A) Double labeling with FPC (804) (a and d), LTL (b), or DBA (e) showed no immunoreactivity in glomeruli (G) and proximal tubules (PT) but did show immunoreactivity in the apical and basolateral areas of collecting tubules (CT) in the human kidney cortex (c and f). (g, h, and k) Immunoreactivity of FPC (804) was found along collecting ducts (CD) in the medulla of the human kidney (arrows). (i) No signals were observed with the preimmune serum (804). (j) Preincubation of FPC antibody (α-FPC) (804) with its immunogen completely blocked the membrane and cytosol labeling. 804 (h) and 803 (l) FPC antibodies gave similar staining patterns in the medulla of the human kidney. (B) 804 recognized a band at ∼450 kDa by IB in tissue extracts of human kidney medullas from two normal individuals (1 and 2), and this band was not detectable if FPC antibody was preincubated with its immunogen. Bars, 100 μm (a to g, i, and j), 50 μm (h and l), and 25 μm (k).
FIG. 2.
FIG. 2.
Results of studies on FPC and PC2 interaction in MDCK cells. (A) Double labeling of FPC (803) (a and d) or PC2 (96525) (g and j) with E-cadherin (b and h) or acetylated antitubulin (acet. α-tub) (e and k) showed that both FPC and PC2 were localized at the plasma membrane (c and i) and on the primary cilium (f and l). Preincubation of 803 with its immunogen completely abolished the staining on the cilium and at the plasma membrane (m to o). (B) Western blot analysis showed that FPC expression increased gradually from day 0 to day 4 postconfluence, peaked at day 5, and then decreased rapidly (left). The line graph (right) showed the expression level of FPC after normalization with β-actin by using NIH Image software (version 1.63). (C) FPC and PC2 were reciprocally immunoprecipitated in MDCK cells. One band at ∼450 kDa and one at ∼110 kDa (arrowheads) were detected with FPC (804) and PC2 antibody after IP with the respective FPC (4883) and PC2 antibodies; IgG was used as a control. (D) PC2 can be coimmunoprecipitated by anti-mouse FPC antibody (α-mFPC) (5249) in mouse kidney tissues. Preimmune (Pre) and PC2 antibodies were used as negative and positive controls, respectively. The asterisk indicates a nonspecific band.
FIG. 3.
FIG. 3.
Characterization of FPC stable knockdown in IMCD-3 cells. (A and B) Six siRNA constructs (BS/U6/GFP/F939, BS/U6/GFP/F1417, pSilencer2.1/U6/F2141, pSilencer2.1/U6/F2850, pSilencer2.1/U6/F11689, and pSilencer2.1/U6/F11813) were made and tested for transiently transfected FPC knockdown in IMCD-3 cells (B, left). (B) F2141 and F2850 were also tested by transient cotransfection with the FPC mini-construct pcDNA3.1/mPkhd1NT2 containing the target sequences (right). Compared with the control, five of the six constructs with the exception of F11689 had significant knockdown effects on FPC transcripts, especially F2141 and F11813, by real-time PCR (left). Expression of the FPC recombinant protein was also significantly reduced by the tested constructs (F2141 and F2850), particularly the latter one (right). (C) In stable FPC knockdown cells (F2850S1), FPC transcripts were significantly reduced (90%) compared to those in the parental cells (control) by real-time and standard RT-PCR. In F2141S26 knockdown cells, FPC transcripts were dramatically decreased compared to those in the control cells (WT4) stably transfected with empty vector. TM, nucleotides for the transmembrane domain; α-myc, anti-myc.
FIG. 4.
FIG. 4.
Characterization of a new anti-mouse FPC antibody and FPC and PC2 interaction in FPC knockdown IMCD-3 cells. (A) Affinity-purified antipeptide antibody (5249) was raised against the intracellular domain of mouse FPC. Cell lysates of HEK 293T cells, transfected with the cytosolic C-terminal tail of mouse FPC (pcDNA3.mpkhd1.ct) with a myc tag or empty vector, were blotted with the indicated antibodies. Both 5249 and anti-myc tag (α-myc) antibodies, but not preimmune and antibody-depleted IgY, recognized the recombinant FPC fragment. (B and C) PC2-FPC interaction in FPC knockdown cells. (B) IB following IP with antibody to the N terminus of FPC (804) revealed a significant reduction of FPC. However, the amounts of FPC-associated PC2 were similar in control and F2850S1 knockdown cells (left). With PC2 IP, no obvious difference of either PC2 or FPC was noticed between control and knockdown cells (right). (C) PC2-FPC interaction in another FPC knockdown clone targeted at a different site of Pkhd1 (F2141S26). Two bands (arrowheads) immunoprecipitated by the FPC C-terminal tail antibody 5249 were apparently absent or reduced in the knockdown cells when blotted with both N-terminal (804) and C-terminal (5249) antibodies. Blotting with PC2 antibody (96525) showed a slight reduction of FPC-associated PC2 in this knockdown clone, compared to that in cells expressing the siRNA vector alone (WT4). IgY was used as a control for IP, and β-actin was used as a loading control for cell lysates used for IP. (D) Detection of Kif3a (arrowhead) and Kif3b in immunoprecipitates of FPC and PC2 in MDCK cells. Cell lysate and IgG were used as controls.
FIG. 5.
FIG. 5.
Effect of FPC knockdown on ciliogenesis. (A) In IMCD-3 cells, FPC was expressed mainly in the basal body area (a and a′) and partially colocalized with acetylated α-tubulin (acet. α-tub) (b and b′). FPC staining in the basal body area was moderately decreased in FPC knockdown cells (d and d′). (B) With acetylated α-tubulin staining (e and e′), the number and length of the primary cilia were not affected by FPC knockdown. Nuclei were stained with DAPI (c, c′, f, and f′). Panels d, d′, g, and g′ are merged images.
FIG. 6.
FIG. 6.
Effects of FPC knockdown on PC2 and PC1. (A and B) Transcripts and protein expression of β-actin were evaluated by semiquantitative RT-PCR and IB as a control. No difference was found between parental IMCD-3 cells and FPC knockdown cells (F2850S1). PC1 and PC2 were also examined by semiquantitative RT-PCR (C and D), IB, and immunostaining (E and F). (C and D) Transcript levels of neither PC2 nor PC1 were changed after FPC knockdown. The upper numbers (15, 20, 25, 30, and 35) indicate the number of PCR cycles. (E) By immunocytochemistry, plasma membrane localization patterns of PC2 appeared to be similar between IMCD-3 and F2850S1 cells (a and a′). The cilium staining pattern and intensity of PC2 (E, d and d′) and PC1 (F, h and h′) were not changed with knockdown of FPC. (E) No changes in PC2 expression were confirmed with IB of parental IMCD-3 and F2850S1 cells. The cilium was stained with acetylated antitubulin (acet. α-tub) (E, e and e′, and F, i and i′). Nuclei (b, b′, f, f′, j, and j′) were stained with DAPI. Panels c, c′, g, g′, k, and k′ are merged images.
FIG. 7.
FIG. 7.
Effects of FPC knockdown and FPC antibodies on intracellular calcium responses to fluid flow-induced sheer stress. (A and B) In two IMCD-3 clones, F2850S1 and F2850S12, intracellular calcium responses were reduced compared with those in the parental IMCD-3 cells. A mean of 50 cells in one representative experiment out of five is shown. (C) The application of normal rabbit IgG or 804 antibody preincubated with its peptide immunogen had no effects on the calcium response in MEK cells. (D) Flow-induced calcium response was abolished in MEK cells incubated with antibody 804 (to extracellular epitopes of FPC) but not 803 (to intracellular epitopes of FPC). The results of the antibody experiments with MEK cells show the averages for the five independent experiments performed on different days (50 cells were randomly chosen for each experiment). (E) Antibodies 804 and 803 had similar effects on the calcium response in IMCD-3 cells, as in MEK cells. The results of one representative experiment out of three are shown. %[Ca2+]cyt, percent increase in cytosolic calcium.
FIG. 8.
FIG. 8.
A model of the polycystin-FPC complex at the primary cilium. (A) Upon fluid flow stimulation, mechanical shear stress is transmitted into the cell via membrane proteins on the cilium, which consequently activates a calcium channel such as PC2 and allows calcium entry and subsequently activates the ryanodine receptor (RyR) through a calcium-induced calcium release intracellular signaling mechanism. (B and C) Disruption of the PC1/PC2 protein complex abolishes the Ca2+ entry signal. (D) Blocking of FPC may diminish the Ca2+ signal through the modulation of the polycystin complex and downstream effectors such as RyR. BB, basal body; X, unknown molecule(s).

References

    1. Bergmann, C., F. Kupper, C. Dornia, F. Schneider, J. Senderek, and K. Zerres. 2005. Algorithm for efficient PKHD1 mutation screening in autosomal recessive polycystic kidney disease (ARPKD). Hum. Mutat. 25:225-231. - PubMed
    1. Reference deleted.
    1. Cai, Y., Y. Maeda, A. Cedzich, V. E. Torres, G. Wu, T. Hayashi, T. Mochizuki, J. H. Park, R. Witzgall, and S. Somlo. 1999. Identification and characterization of polycystin-2, the PKD2 gene product. J. Biol. Chem. 274:28557-28565. - PubMed
    1. Calvet, J. P., and J. J. Grantham. 2001. The genetics and physiology of polycystic kidney disease. Semin. Nephrol. 21:107-123. - PubMed
    1. Chomczynski, P., and N. Sacchi. 1987. Single-step method of RNA isolation by acid guanidinium thiocyanate-phenol-chloroform extraction. Anal. Biochem. 162:156-159. - PubMed

Publication types

MeSH terms