. 2007 Apr;27(8):2934-51.
doi: 10.1128/MCB.01609-06. Epub 2007 Feb 5.

Bmp2 transcription in osteoblast progenitors is regulated by a distant 3' enhancer located 156.3 kilobases from the promoter

Affiliations

Bmp2 transcription in osteoblast progenitors is regulated by a distant 3' enhancer located 156.3 kilobases from the promoter

Ronald L Chandler et al. Mol Cell Biol. 2007 Apr.

Abstract

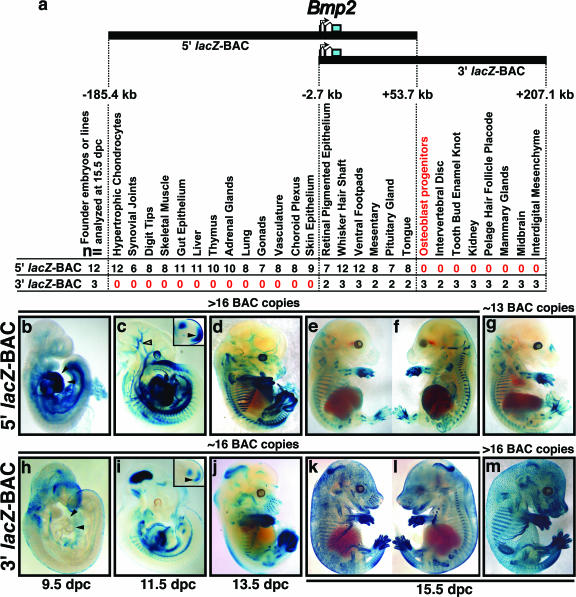
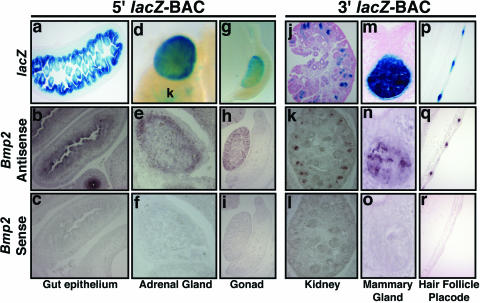
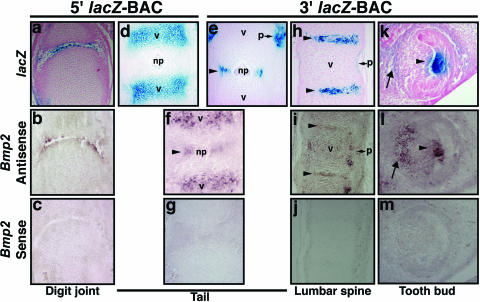
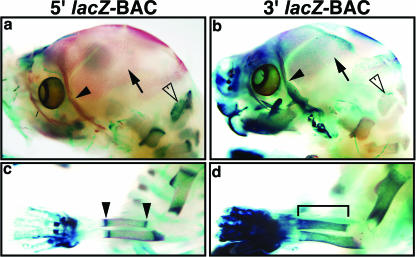
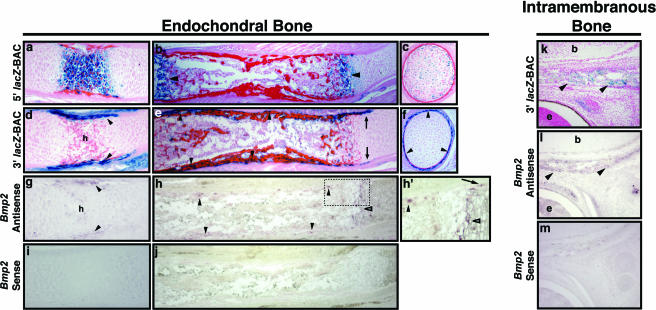
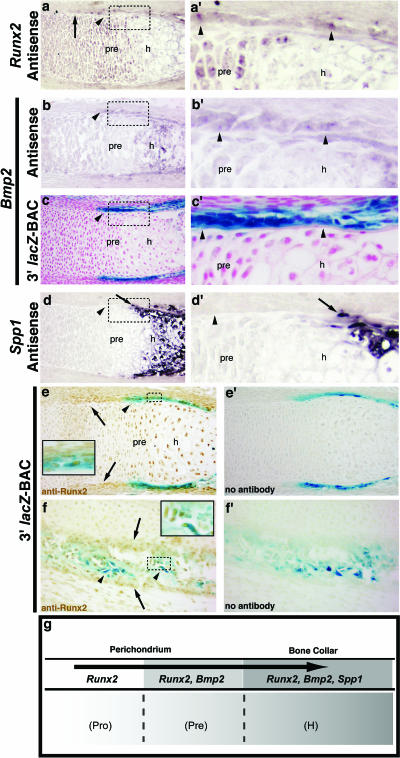
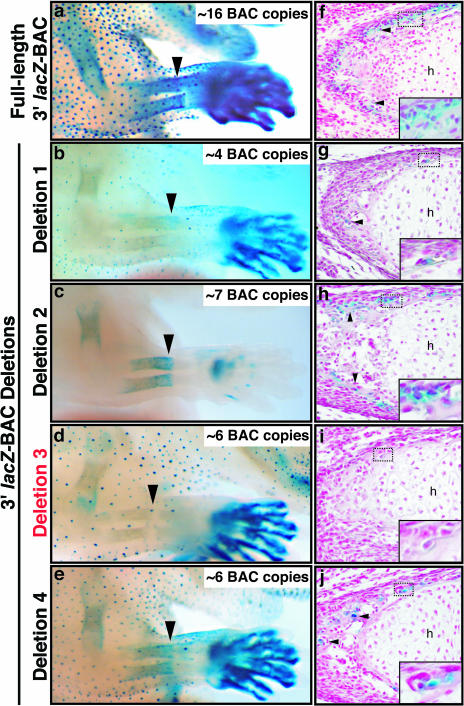
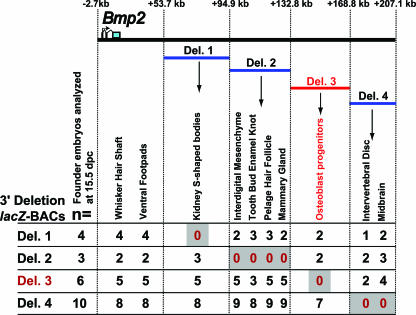
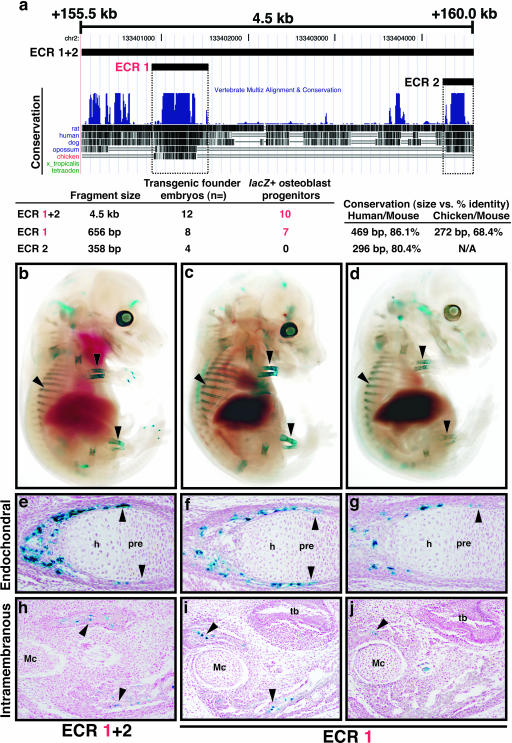
Bone morphogenetic protein 2 (encoded by Bmp2) has been implicated as an important signaling ligand for osteoblast differentiation and bone formation and as a genetic risk factor for osteoporosis. To initially survey a large genomic region flanking the mouse Bmp2 gene for cis-regulatory function, two bacterial artificial chromosome (BAC) clones that extend far upstream and downstream of the gene were engineered to contain a lacZ reporter cassette and tested in transgenic mice. Each BAC clone directs a distinct subset of normal Bmp2 expression patterns, suggesting a modular arrangement of distant Bmp2 regulatory elements. Strikingly, regulatory sequences required for Bmp2 expression in differentiating osteoblasts, as well as tooth buds, hair placodes, kidney, and other tissues, are located more than 53 kilobases 3' to the promoter. By testing BACs with engineered deletions across this distant 3' region, we parsed these regulatory elements into separate locations and more closely refined the location of the osteoblast progenitor element. Finally, a conserved osteoblast progenitor enhancer was identified within a 656-bp sequence located 156.3 kilobases 3' from the promoter. The identification of this enhancer should permit further investigation of upstream regulatory mechanisms that control Bmp2 transcription during osteoblast differentiation and are relevant to further studies of Bmp2 as a candidate risk factor gene for osteoporosis.


Figures

FIG. 1.
FIG. 1.
lacZ-BAC transgene scan for Bmp2 cis-regulatory function. (a) UCSC Genome Browser plot of a 392.5-kb region of the mouse Bmp2 locus and BAC genomic insert positions relative to the previously reported Bmp2 transcription start site (23). The blue box in the third exon of Bmp2 denotes the relative position of the IRES-β-geo cassette in each BAC construct. The summary table shows expression data arranged in three groups to reflect the regions unique to the 5′ BAC, common to both, or unique to the 3′ BAC that contain putative regulatory elements required for expression in specific locations. The far left column shows the number of transgenic embryos or stable lines analyzed for each 5′ and 3′ BAC integration event. Twelve 5′ BAC and three 3′ BAC transgenic embryos/lines were analyzed at 15.5 dpc. Column labels indicate specific sites of lacZ expression. Numbers below each site description denote the number of transgenic embryos/lines with detectable X-Gal staining in the specific anatomical location. (b to m) Whole-mount X-Gal-stained 9.5-, 11.5-, 13.5-, and 15.5-dpc 5′ BAC (b to g) and 3′ BAC (h to m) embryos. (b) A 9.5-dpc 5′ BAC embryo showing expression in early heart mesoderm (arrowheads), ventral trunk region, and extraembryonic tissues. (h) A 9.5-dpc 3′ BAC embryo showing expression in the anterior ectoderm of the head and along the dorsal midline. No X-Gal staining is observed in the heart mesoderm (arrowheads) at this stage. (c) An 11.5-dpc 5′ BAC embryo with expression in early vasculature (open arrowhead), eye lens, trunk, and tail bud. The inset shows an 11.5-dpc 5′ BAC hindlimb bud showing expression in posterior/distal mesenchyme (arrowhead) and AER as well as an anterior/proximal domain. (d) Similar patterns in the posterior/distal mesenchyme and AER are observed in 3′ BAC hindlimb bud, but also a central domain of expression is present, unlike the anterior/proximal expression seen in panel c. (e, f, k, and l) Medial and lateral images of bisected, whole-mount 15.5-dpc embryos for the 5′ BAC (e and f) and 3′ BAC (k and l). (g and m) 5′ BAC and 3′ BAC 15.5-dpc embryos, respectively, that were derived from independent transgene injections in addition to those used to make the stable lines depicted in panels b to f and h to l. Notice the consistent patterns of lacZ expression between embryos depicted in panels e versus g and k versus m. Copy number estimates based on real-time PCR are shown for 5′ BAC (b to f) and 3′ BAC (h to l) stable lines and for the independently generated embryos (g and m).
FIG. 2.
FIG. 2.
Bmp2 lacZ-BAC transgenes confer normal patterns of endogenous Bmp2 expression in soft tissues in vivo. X-Gal-stained tissues from 15.5-dpc 5′ BAC and 3′ BAC transgenic embryos are shown in comparison to sections of nontransgenic embryos hybridized with riboprobes for mouse Bmp2. Top row, transgenic embryos. Middle row, Bmp2 mRNA in nontransgenic embryos. Bottom row, Bmp2 sense probe controls. (a and b) Section through the gut of a 5′ BAC transgenic embryo, showing lacZ expression in the epithelium facing the lumen (a), similar to Bmp2 (b). (d) Whole-mount X-Gal-stained adrenal gland. k, kidney. (e) Sagittal section through adrenal gland, showing endogenous Bmp2 expression in the outer cortex layer. (g) Whole mount of X-Gal-stained gonad. (h) Sagittal section showing endogenous Bmp2, similar to lacZ in panel g. (j) Sagittal section through X-Gal-stained kidney from a 3′ BAC transgenic embryo, showing expression in comma- and s-shaped bodies. (k) Near-adjacent section to panel j, showing Bmp2 expression similar to expression in panel j. (m) Section through X-Gal-stained mammary gland, showing strong expression in the secretory epithelium, similar to that of endogenous Bmp2 (n). (p) Near-sagittal section through dorsal midline of an X-Gal-stained 3′ BAC transgenic embryo. (q) Section similar to that in panel p of a nontransgenic embryo hybridized with a Bmp2 antisense probe. lacZ and endogenous Bmp2 transcripts are present in the invaginating epithelial buds of pelage hair follicle placodes shown in panels p and q.
FIG. 3.
FIG. 3.
Bmp2 lacZ-BAC transgenes confer normal patterns of endogenous Bmp2 expression in skeletal joints and teeth. X-Gal-stained skeletal tissues from 5′ and 3′ BAC transgenic embryos are shown in comparison to age-matched sections of nontransgenic embryos hybridized with antisense or sense riboprobes for Bmp2. (a) Section through X-Gal-stained distal portion of hindlimb digit from a 17.5-dpc 5′ BAC transgenic embryo from a stable line. lacZ-positive cells are located in the middle or deep articular layers of the digit joint. (b) Section similar to that in panel a, showing Bmp2 mRNA in a nontransgenic embryo. (d) Sagittal section through the tail of an X-Gal-stained 15.5-dpc 5′ BAC embryo, showing expression in hypertrophic chondrocytes of vertebral bodies. (e) Sagittal section through the tail of an X-Gal-stained 15.5-dpc 3′ BAC embryo, showing expression in the annulus fibrosus layer (arrowhead) surrounding the nucleus pulposus. (f) Endogenous Bmp2 in both the annulus fibrosus layer (arrowhead) and hypertrophic chondrocytes. (h and i) Sagittal section through the lumbar spine of an X-Gal-stained 15.5-dpc 3′ BAC transgenic embryo, showing expression in the annulus fibrosus layer (h, arrowheads) similar to that of Bmp2 mRNA in nontransgenic embryos (i, arrowheads). (k and l) Near-sagittal sections through incisor tooth buds of an X-Gal-stained 15.5-dpc 3′ BAC embryo and a 15.5-dpc nontransgenic embryo. lacZ and endogenous Bmp2 are expressed in the enamel knot (arrowhead) and dental papilla mesenchyme (arrow). np, nucleus pulposus; p, perichondrium; v, vertebral body.
FIG. 4.
FIG. 4.
Bmp2 cis-regulation in bone. X-Gal- and alizarin red-stained 17.5-dpc whole-mount 5′ and 3′ BAC embryonic head and forelimb skeletons generated from stable lines are shown. Alizarin red staining is shown in red and labels ossified bone. (a and b) Whole-mount 17.5-dpc 5′ and 3′ head skeletons, respectively. (a) No X-Gal staining can be seen in the intramembranous parietal (arrow) or zygomatic (closed arrowhead) bones; however, staining is present in the endochondral occipital bone (open arrowhead). (b) Numerous lacZ-positive cells are present in the parietal (arrow), zygomatic (closed arrowhead), and occipital (open arrowhead) bones. (c and d) Whole-mount 17.5-dpc 5′ and 3′ forelimb skeletons, respectively. (c) Stripes of X-Gal staining can be seen at the ends of the ossified regions in the long bones, corresponding to the growth plate region (arrowheads). (d) X-Gal staining is present throughout the ossified regions (bracket) of the long bones.
FIG. 5.
FIG. 5.
Bmp2 lacZ-BACs confer endogenous expression in developing bone. X-Gal-stained endochondral bone sections from representative 5′ and 3′ BAC transgenic embryos are shown in comparison to sections of nontransgenic embryos hybridized with Bmp2 antisense or sense probes. (a and b) Sections through X-Gal-stained metacarpal and radius condensations, respectively, from 17.5-dpc 5′ BAC transgenic embryos generated from stable lines. lacZ expression is observed in hypertrophic chondrocytes of the metacarpal (a) and growth plate regions (b) (arrowheads) of the radius. (c) Cross-section through the radius growth plate, showing lacZ-positive hypertrophic chondrocytes. No lacZ-positive cells are observed in the perichondrium/bone collar region surrounding the cartilage. (d and e) Sections through X-Gal-stained metacarpal (d) and radius (e) condensations from 17.5-dpc 3′ BAC transgenic embryos generated from stable lines. lacZ expression is observed in the perichondrium/bone collar region flanking the metacarpal hypertrophic zone in panel d. Arrowheads in panel e indicate lacZ-positive cells in the perichondrium and throughout the periosteal bone collar flanking the marrow cavity. Arrows in panel e indicate expression in perichondrium flanking the hypertrophic zone. (f) Cross-section through the radius growth plate region, showing lacZ-positive cells localized to the perichondrium/bone collar (arrowheads) surrounding the hypertrophic zone. (g) Bmp2 mRNA detected in the metacarpal of a nontransgenic 17.5-dpc embryo. Both the hypertrophic chondrocytes and the perichondrium/bone collar (arrowheads) are faintly positive for endogenous Bmp2. (h) Section through radius of a nontransgenic 17.5-dpc embryo, showing numerous Bmp2-positive cells throughout the bone collar (closed arrowheads) flanking the marrow cavity and within the hypertrophic chondrocyte zone (open arrowheads). (h′) Higher magnification of dashed box in panel h. The arrow indicates Bmp2-positive perichondrial cells flanking the hypertrophic zone. (k) Sagittal sections through orbital plate of frontal bone from an X-Gal-stained 15.5-dpc 3′ BAC embryo. (l) Age-matched section to panel k hybridized with a Bmp2 antisense probe. The arrowheads in panels k and l indicate expression in cells located in ossifying regions. b, brain; e, eye; h, hypertrophic zone.
FIG. 6.
FIG. 6.
Analysis of Bmp2 expression in comparison to osteogenic markers in vivo. (a to e and a′ to e′) Sections of 15.5-dpc radii. (f and f′) Sections of 15.5-dpc frontal bone (orbital plate). (a, b, and d) In situ hybridization of Runx2, Bmp2, and Spp1 mRNAs in nontransgenic embryos. (c) Section through X-Gal-stained 3′ BAC transgenic embryo. The boxed regions in panels a, b, c, and d are shown at a higher magnification in panels a′, b′, c′, and d′. The arrowheads in panels a, b, and c indicate expression in cells in the perichondrium/bone collar region flanking the prehypertrophic and hypertrophic zones. The arrowheads in panel d indicate lack of Spp1 expression in these regions. The arrow in panel a indicates faint Runx2 expression in the inner perichondrium flanking the zones of proliferative and resting chondrocytes. The arrows in panels d and d′ indicate Spp1-positive osteoblasts lining the outer surface of the bone collar. (e) Section from 3′ BAC embryo, showing Runx2 protein and Bmp2-lacZ colocalization in the osteogenic perichondrium/bone collar. Coexpressing cells (arrowheads in panel e and inset) are evidenced by brown nuclei (stained with anti-Runx2 antibody) and blue X-Gal stain in the cytoplasm (Bmp2-lacZ). Runx2 protein is also present in prehypertrophic and hypertrophic chondrocytes, and the arrows indicate a stronger Runx2 signal in the inner perichondium flanking the proliferative and resting chondrocytes. (e′) Section adjacent to that in panel e, showing a no-antibody control. (f) Section through frontal bone from a 3′ BAC transgenic embryo. Runx2 and Bmp2-lacZ colocalize in osteogenic cells lining newly formed bone (arrowheads and inset). The arrows indicate Runx2 in mesenchyme surrounding ossifying regions. In panels e and f, the insets show a higher magnification of the dashed-box regions. (g) Schematic representation showing the relationship of Bmp2 transcription and osteogenic markers during osteoblast differentiation. h, hypertrophic zone; pre, prehypertrophic zone; pro, proliferating zone.
FIG. 7.
FIG. 7.
Numerous cis-regulatory sequences are dispersed throughout the distant 3′ region. Shown are whole-mount X-Gal-stained forelimbs and oblique, near-adjacent sections through the radius from full-length 3′ lacZ-BAC and 3′ deletion lacZ-BAC embryos. The arrowheads in panels a to e indicate the distal end of the ossifying zone of the radius. (a, b, c, and e) X-Gal staining can be seen in the long bones (radius, ulna, and humerus) of the forelimbs in full-length 3′ lacZ-BAC and 3′ deletion lacZ-BAC D1, D2, and D4 embryos. (d) No staining is present the D3 embryo shown. The arrowheads in panels f, g, h, and j indicate lacZ-positive osteoblasts in ossifying regions of the radius bone sections shown. In panels f to j, the insets show a higher magnification of the dashed-box regions. (i) No staining is present in the section through the radius of the D3 embryo shown. BAC transgene copy number estimates are indicated for the embryos shown in panels a to e. h, hypertrophic zone.
FIG. 8.
FIG. 8.
Summary of 3′ deletion lacZ-BAC mapping data. The expression data are arranged in five groups to reflect the expression patterns present in full-length 5′ and 3′ lacZ-BAC transgenes (kb −2.7 to +53.7) or lost in 3′ deletion lacZ-BAC transgenes. The far-left column shows the number of transgenic founder embryos analyzed for each deletion BAC integration event. Between 3 and 10 deletion BAC transgenic founder embryos were analyzed at 15.5 dpc. The numbers below each site of expression denote the number of transgenic founder embryos for each deletion BAC with detectable X-Gal staining within the specific anatomical location listed above.
FIG. 9.
FIG. 9.
Bmp2 cis-regulation in osteoblast progenitors is controlled by a distant 3′ enhancer that is conserved between mammals and chicken. (a) UCSC genome browser plot of approximately 4.5 kb of mouse chromosome 2 (mouse February 2006 assembly; chr2, 133400083 to 133404598) (35), showing ECRs tested for enhancer activity using heterologous (Hsp68) promoter-lacZ minigenes. The sizes of the ECR-1 + 2, ECR-1, and ECR-2 fragments tested are drawn on the browser plot and listed below it. Also shown are vertebrate MultiZ alignment and conservation tracks (6) as well as ECR size and percent identity generated by the ECR browser (59). ECR-1 is the only region conserved between mammals and chicken. (b) Whole-mount X-Gal-stained 15.5-dpc representative ECR-1 + 2 transgenic founder embryo. (c and d) Whole-mount X-Gal-stained 15.5-dpc ECR-1 transgenic founder embryos. The 15.5-dpc embryos shown in panel d are derived from a transgene integration event independent from those depicted in panel c. The arrowheads in panels b, c, and d indicate X-Gal staining in bones of the forelimb and hindlimb and in ribs. (e to g) Near-adjacent sections through radii of the embryos shown in panels b to d. Note that lacZ-positive osteoblasts are dispersed through the ossifying regions of the radius, and this expression extends to the perichondrium region surrounding the prehypertrophic zone (arrowheads). (h to j) Near-adjacent sections through mandibles from the embryos shown in panels b to d. The arrowheads in panels h to j indicate lacZ-positive osteoblasts present throughout membranous bone. h, hypertrophic zone; pre, prehypertrophic zone; Mc, Meckel's cartilage; tb, tooth bud.

Similar articles

Cited by

References

    1. Abrams, K. L., J. Xu, C. Nativelle-Serpentini, S. Dabirshahsahebi, and M. B. Rogers. 2004. An evolutionary and molecular analysis of Bmp2 expression. J. Biol. Chem. 279:15916-15928. - PubMed
    1. Aubin, J. E. 1998. Advances in the osteoblast lineage. Biochem. Cell Biol. 76:899-910. - PubMed
    1. Berman, B. P., Y. Nibu, B. D. Pfeiffer, P. Tomancak, S. E. Celniker, M. Levine, G. M. Rubin, and M. B. Eisen. 2002. Exploiting transcription factor binding site clustering to identify cis-regulatory modules involved in pattern formation in the Drosophila genome. Proc. Natl. Acad. Sci. USA 99:757-762. - PMC - PubMed
    1. Bitgood, M. J., and A. P. McMahon. 1995. Hedgehog and Bmp genes are coexpressed at many diverse sites of cell-cell interaction in the mouse embryo. Dev. Biol. 172:126-138. - PubMed
    1. Blackman, R. K., M. Sanicola, L. A. Raftery, T. Gillevet, and W. M. Gelbart. 1991. An extensive 3′ cis-regulatory region directs the imaginal disk expression of decapentaplegic, a member of the TGF-beta family in Drosophila. Development 111:657-666. - PubMed

Publication types

MeSH terms