. 2007 Jun 8;282(23):16718-28.
doi: 10.1074/jbc.M700647200. Epub 2007 Feb 5.

Involvement of dihydroceramide desaturase in cell cycle progression in human neuroblastoma cells

Affiliations

Involvement of dihydroceramide desaturase in cell cycle progression in human neuroblastoma cells

Jacqueline M Kraveka et al. J Biol Chem. .

Abstract

The role of dihydroceramide desaturase as a key enzyme in the de novo pathway of ceramide generation was investigated in human neuroblastoma cells (SMS-KCNR). A novel assay using water-soluble analogs of dihydroceramide, dihydroceramidoids (D-erythro-dhCCPS analogs), was used to measure desaturase activity in situ. Conversion of D-erythro-2-N-[12'-(1''-pyridinium)-dodecanoyl]-4,5-dihydrosphingosine bromide (C(12)-dhCCPS) to its 4,5-desaturated counterpart, D-erythro-2-N-[12'-(1''-pyridinium)dodecanoyl]sphingosine bromide (C(12)-CCPS), was determined by liquid chromatography/mass spectrometry analysis. The validity of the assay was confirmed using C(8)-cyclopropenylceramide, a competitive inhibitor of dihydroceramide desaturase. A human homolog (DEGS-1) of the Drosophila melanogaster des-1 gene was recently identified and reported to have desaturase activity. Transfection of SMS-KCNR cells with small interfering RNA to DEGS-1 significantly blocked the conversion of C(12)-dhCCPS to C(12)-CCPS. The associated accumulation of endogenous dihydroceramides confirmed DEGS-1 as the main active dihydroceramide desaturase in these cells. The partial loss of DEGS-1 inhibited cell growth, with cell cycle arrest at G(0)/G(1). This was accompanied by a significant decrease in the amount of phosphorylated retinoblastoma protein. This hypophosphorylation was inhibited by tautomycin and not by okadaic acid, suggesting the involvement of protein phosphatase 1. Additionally, we found that treatment of SMS-KCNR cells with fenretinide inhibited desaturase activity in a dose-dependent manner. An increase in dihydroceramides (but not ceramides) paralleled this process as measured by liquid chromatography/mass spectrometry. There were no effects on the mRNA or protein levels of DEGS-1, suggesting that fenretinide acts at the post-translational level as an inhibitor of this enzyme. Tautomycin was also able to block the hypophosphorylation of the retinoblastoma protein observed upon fenretinide treatment. These findings suggest a novel biological function for dihydroceramides.


Figures

Figure 1
Figure 1. Conversion of C12-dhCCPS to C12-CCPS in cells
(A) The scheme depicts the intracellular oxidation of dihydro-ceramidoid C12-dhCCPS to the corresponding ceramidoid C12-CCPS by the enzyme dihydroceramide desaturase (B) SMS-KCNR and MCF-7 cells were treated with 0.5 μM C12-dhCCPS for 15 min, 2 h, 6 h and 24 h. Cells were harvested at these time points, and pyridinium conjugated ceramidoids (Pyr-Cers) were measured by LC/MS as described in the “Experimental Procedures.” The percentage of the total detected Pyr-Cers that was converted to C12-dhCCPS are depicted here. The data presented are representative of the mean of at least three independent experiments ± S.D. The error bars represent the standard deviations, and when not seen, they are smaller than the thickness of the lines on the graphs.
Figure 2
Figure 2. Effects of C8-CPPC on desaturase activity
(A) SMS-KCNR cells were pre-treated with increasing concentrations of the dihydroceramide desaturase inhibitor C8-CPPC for 30 minutes and then 0.5 μM C12-dhCCPS was added for 6 h. Cells were collected after 6 h and the conversion to C12-CCPS was measured by LC/MS as described in “Experimental Procedures.” (B) Total endogenous levels of ceramides (Cer), dihydroceramides (dhCer), (C) dihydrosphingosine (dhSph), dihydrosphingosine-1- phosphate (dhSph-1P), sphingosine (Sph), sphinogosine-1-phosphate (Sph-1P), (D) Cer species, (E) and dhCer species were measured by LC/MS as described under “Experimental Procedures.” The sphingolipid levels were normalized to total lipid phosphate. The data presented are representative of the mean of 2 independent experiments, performed in duplicate ± S.D. The error bars represent the standard deviations, and when not seen, they are smaller than the thickness of the lines on the graphs.
Figure 3
Figure 3. Effects of inhibition of human DEGS-1 with siRNA on desaturase activity and sphingolipid levels
SMS-KCNR cells were transfected with 10 nM DEGS-1 or a nonspecific siRNA (SCR) and collected after 48 h. Control refers to untreated cells. Knockdown of DEGS-1 mRNA levels was confirmed by semi-quantitative RT-PCR (A left panel). The mRNA levels of 28S rRNA were used as internal controls. Expression of the DEGS-1 protein was also detected by Western blotting (A right panel). Total cell lysates were prepared 48 h after siRNA transfection. Equal amounts of proteins (30 μg) were run on 10% SDS-PAGE and blotted onto an Immobilon membrane as described in “Experimental Procedures.” β-actin was probed to verify equal loading of proteins per lane. The figures presented are representative of at least three independent experiments. (B) Inhibition of the DEGS-1 activity was confirmed using our in-situ assay for dihydroceramide desaturase activity. In siRNA transfected (DEGS-1 and SCR) and untransfected (control) cells, 0.5 μM C12-dhCCPS was added to the media 48 h post-transfection for 6 h. The conversion to C12-CCPS was measured by LC/MS as described in “Experimental Procedures.” (C) Total endogenous levels of ceramides (Cer), dihydroceramides (dhCer), (D) Cer species, (E) and dhCer species were measured by LC/MS as described under “Experimental Procedures.” The sphingolipid levels were normalized to total lipid phosphate. The data presented are representative of the mean of 3 independent experiments ± S.D. The error bars represent the standard deviations, and when not seen, they are smaller than the thickness of the lines on the graphs.
Figure 4
Figure 4. Effects of DEGS-1 inhibition at 2,4, and 6 days after siRna on sphingolipid levels
(A) SMS-KCNR cells were transfected with 10 nM DEGS-1 or a nonspecific siRNA (SCR) and total cell lysates collected 2, 4, and 6 days after transfection. Control refers to untreated cells. Knockdown of the DEGS-1 protein was detected by Western blotting. Equal amounts of proteins (30 μg) were run on 10% SDS-PAGE and blotted onto an Immobilon membrane as described in “Experimental Procedures.” β-actin was probed to verify equal loading of proteins per lane. The figures presented are representative of at least two independent experiments. (B-D) Total endogenous levels of ceramides (Cer) and dihydroceramides (dhCer) were measured by LC/MS on days 2 (B), 4 (C) and 6 (D) after siRNA transfecton as described under “Experimental Procedures.” The sphingolipid levels were normalized to total lipid phosphate. The data presented are representative of the mean of 2 independent experiments performed in duplicate ± S.D. The error bars represent the standard deviations, and when not seen, they are smaller than the thickness of the lines on the graphs.
Figure 5
Figure 5. Effects of DEGS-1 inhibition on Cell Growth, Cell Cycle and pRb
(A) The effects of loss of DEGS-1 on cell growth were determined by the trypan blue exclusion method as described under “Experimental Procedures.” SMS-KCNR cells were transfected with 10 nM DEGS-1 or a nonspecific siRNA (SCR) for 24 h and then split and plated, along with untransfected cells (control) in 6-well dishes (~ 5000 cells/well) in triplicate. Cells were counted on days 2, 4, and 6, and then the inhibition of growth in response to siRNA was determined from the cell survival plots. (B) The effects of siRNA to DEGS-1 on cell cycle profiles were determined and compared to that of untreated and non-specific siRNA (SCR) treated cells after 48 h using flow cytometry as described in “Experimental Procedures.” The figures presented are representative of at least two independent experiments. (C) Protein levels of pRb, total Rb, and β-actin were detected by Western blotting. Cells were pretreated for ~18 h with either 10 nM OA (C, center panel) or 10 nM TMY (C, right panel) prior to siRNA transfection. Total cell lysates were prepared 48 h after siRNA transfection. Equal amounts of proteins (30 μg) were run on 10% SDS-PAGE and blotted onto an Immobilon membrane as described in “Experimental Procedures.” β-actin was probed with to verify equal loading of proteins per lane. The figures presented are representative of at least three independent experiments.
Figure 6
Figure 6. Effects of Fenretinide on Endogenous Sphingolipids and Desaturase Activity
(A) SMS-KCNR cells were treated with increasing concentrations of 4-HPR for 6 h. Total endogenous levels of ceramides (Cer), dihydroceramides (dhCer), (B) Cer species, (C) and dhCer species were measured by LC/MS as described under “Experimental Procedures.” The sphingolipid levels were normalized to total lipid phosphate. The data presented are representative of the mean of 3 independent experiments ± S.D. (D,E) Desaturase activity was measured using our in-situ assay. Cells were treated with increasing concentrations of 4-HPR for 2 and 6 h (D) or 10 μM ATRA for 6 h (E). C12-dhCCPS was added at the same time as 4-HPR or ATRA. Cells were collected at these time points, and the conversion to C12-CCPS was determined by LC/MS. (F) The mRNA levels of 28s rRNA and DEGS-1 in response to 10 μM 4-HPR treatment for 6 and 24 h were measured by semi-quantitative RT-PCR. (F, upper panel) Expression of the DEGS-1 protein was detected by Western blotting (F, lower panel) Total cell lysates were prepared 6 and 24 h after 4-HPR treatment and, run on 10% SDS-PAGE. Equal amounts of proteins (30 μg) were blotted onto an Immobilon membrane as described in “Experimental Procedures.” β-actin was probed to verify equal loading of proteins per lane. The figures presented are representative of at least two independent experiments. The error bars represent the standard deviations, and when not seen, they are smaller than the thickness of the lines on the graphs.
Figure 7
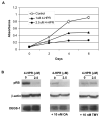
Figure 7. Effects of Fenretinide on Cell Growth and pRB
(A) The effects of low dose 4-HPR treatment (1 and 2.5 μM) on cell growth were determined via MTT assay as described in “Experimental Procedures.” The figures presented are representative of at least two independent experiments performed in triplicate. The error bars represent the standard deviations, and when not seen, they are smaller than the thickness of the lines on the graphs. (B) Protein levels of pRb, β-actin, and DEGS-1 were detected by Western blotting. Cells were pretreated for ~18 h with either 10 nM OA (B, center panel) or 10 nM TMY (C, right panel) prior to 2.5 μM 4-HPR treatment. Total cell lysates were prepared 48 h after 4-HPR treatment. Equal amounts of proteins (30 μg) were run on 10% SDS-PAGE and blotted onto an Immobilon membrane as described in “Experimental Procedures.” β-actin was probed with to verify equal loading of proteins per lane. The figures presented are representative of at least three independent experiments.

Similar articles

Cited by

References

    1. Hannun YA, Obeid LM. J Biol Chem. 2002;277(29):25847–25850. - PubMed
    1. Hannun YA. Adv Exp Med Biol. 1997;400A:305–312. - PubMed
    1. Hannun YA, Luberto C. Trends Cell Biol. 2000;10(2):73–80. - PubMed
    1. Hannun YA, Obeid LM. Biochem Soc Trans. 1997;25(4):1171–1175. - PubMed
    1. Ogretmen B, Hannun YA. Nat Rev Cancer. 2004;4(8):604–616. - PubMed