. 2007 Feb 12;176(4):497-507.
doi: 10.1083/jcb.200607098. Epub 2007 Feb 5.

Formation of microtubule-based traps controls the sorting and concentration of vesicles to restricted sites of regenerating neurons after axotomy

Affiliations

Formation of microtubule-based traps controls the sorting and concentration of vesicles to restricted sites of regenerating neurons after axotomy

Hadas Erez et al. J Cell Biol. .

Abstract

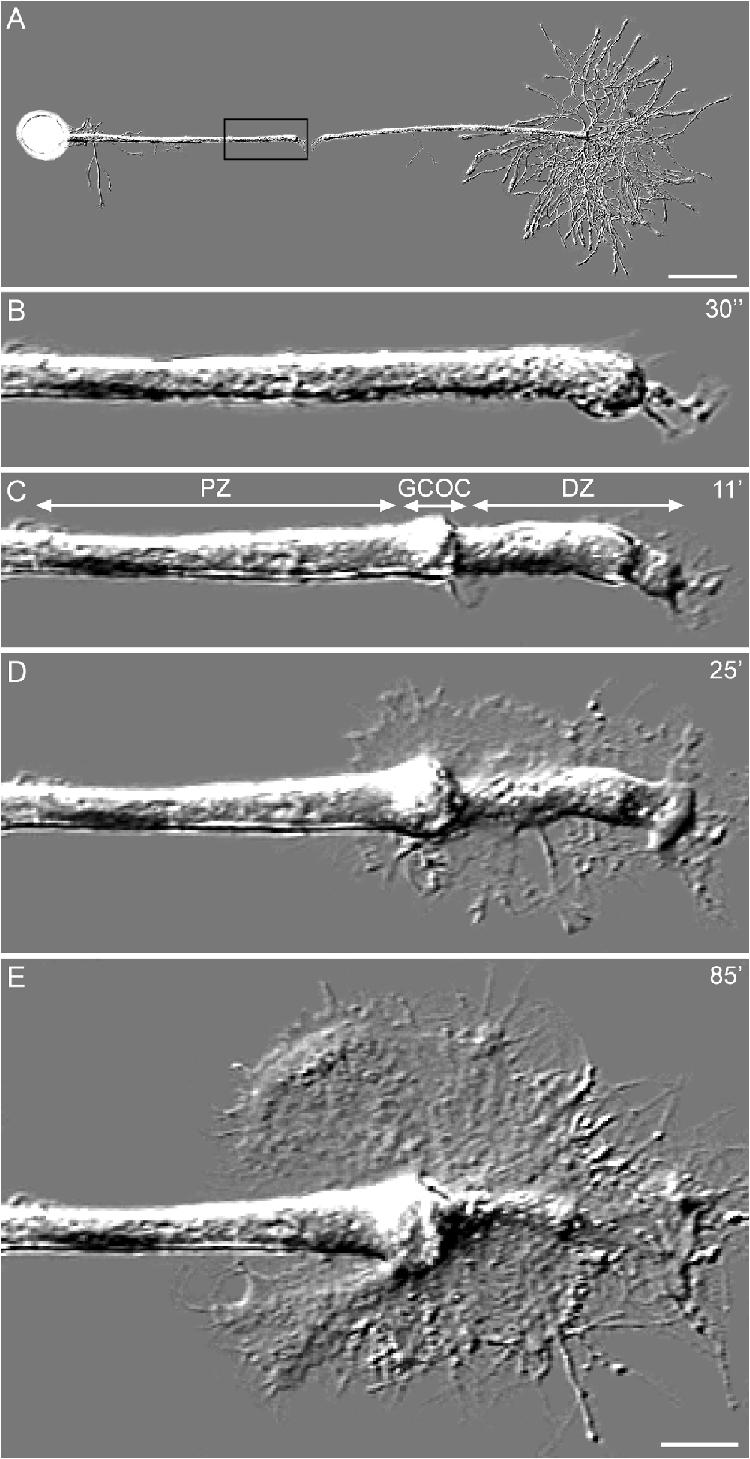
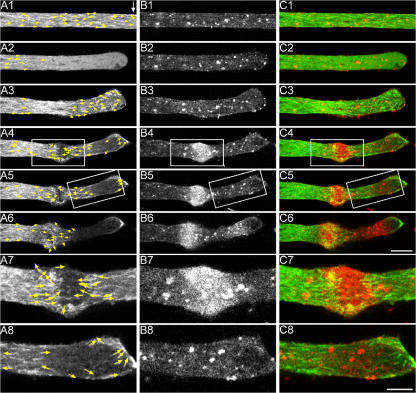
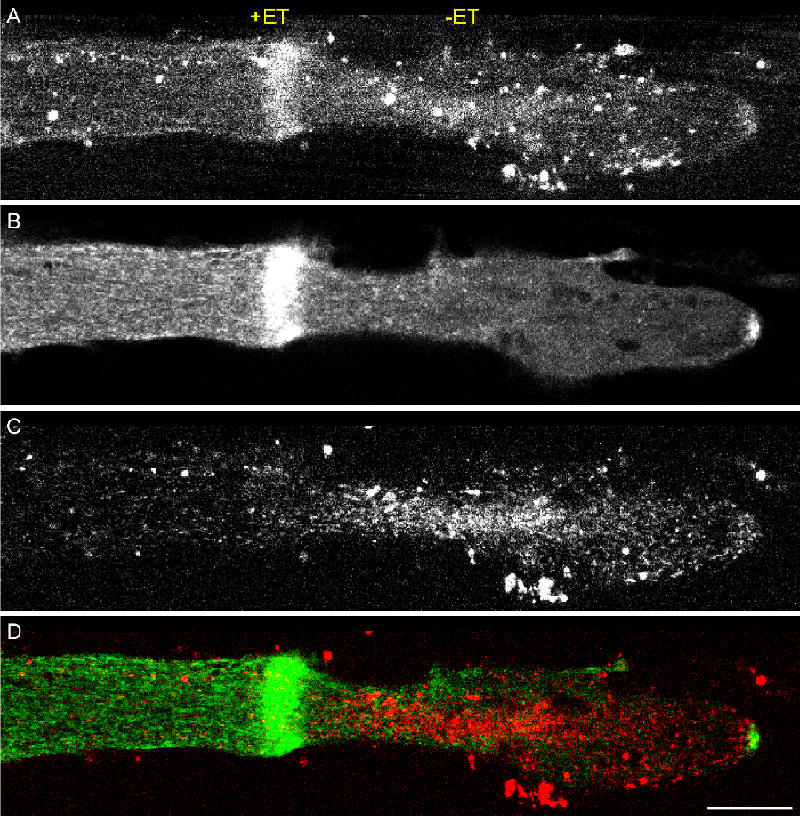
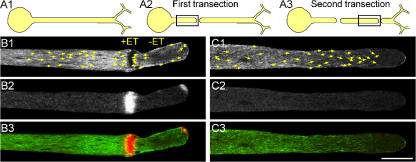
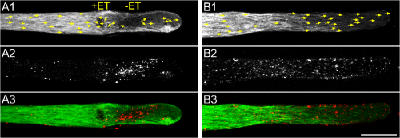
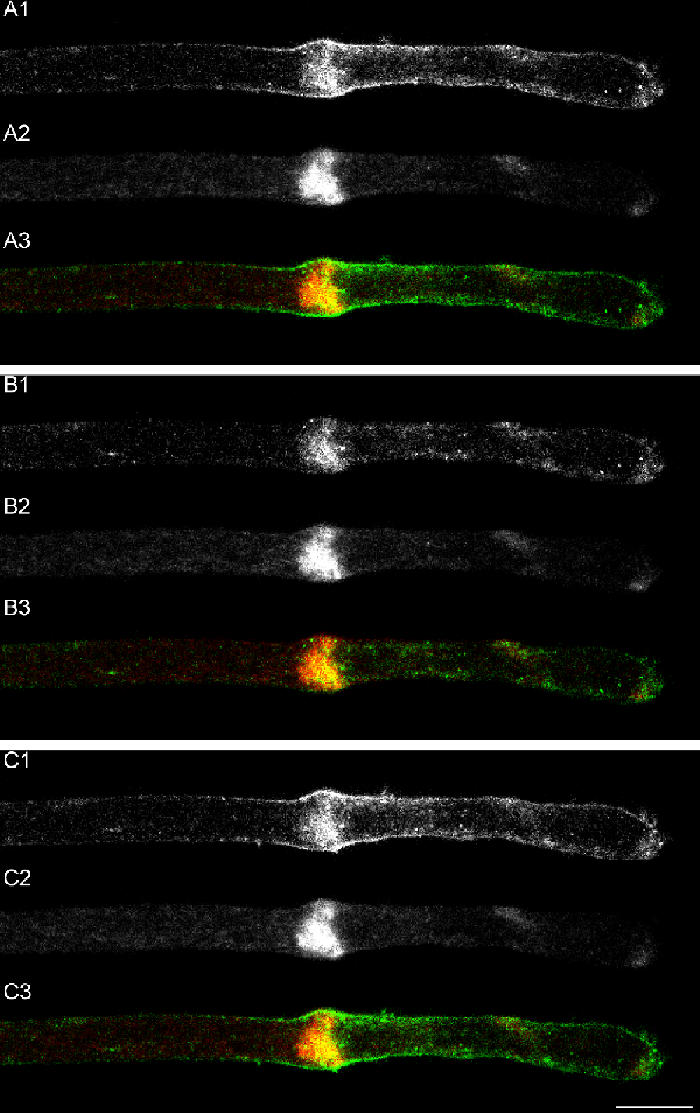
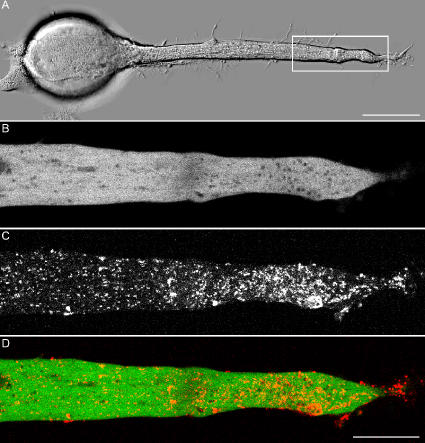
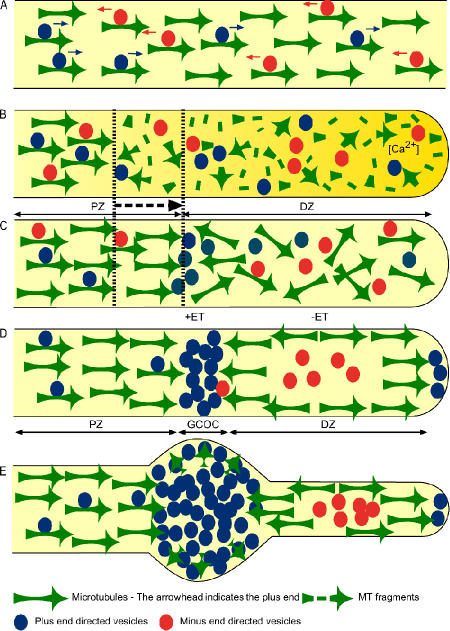
Transformation of a transected axonal tip into a growth cone (GC) is a critical step in the cascade leading to neuronal regeneration. Critical to the regrowth is the supply and concentration of vesicles at restricted sites along the cut axon. The mechanisms underlying these processes are largely unknown. Using online confocal imaging of transected, cultured Aplysia californica neurons, we report that axotomy leads to reorientation of the microtubule (MT) polarities and formation of two distinct MT-based vesicle traps at the cut axonal end. Approximately 100 microm proximal to the cut end, a selective trap for anterogradely transported vesicles is formed, which is the plus end trap. Distally, a minus end trap is formed that exclusively captures retrogradely transported vesicles. The concentration of anterogradely transported vesicles in the former trap optimizes the formation of a GC after axotomy.


Figures

Figure 1.
Figure 1.
The morphological sequence of axonal transformation into a GC after axotomy. (A) A B neuron was cultured for 24 h and transected with a micropipette. (B) After axonal transection, a membrane seal is formed over the cut axonal end. (C) Within 5 min of axotomy, a compartment located ∼75 μm proximally to the cut end of the axon swells. This swollen zone, which is referred to as the GC organizing center (GCOC), subdivides the axon into a distal zone (DZ) and a proximal zone (PZ). (D) The GCOC is the area from which the GC's lamellipodium extends. (E) With time, the DZ retracts. The time after axotomy is given in minutes on the right side of the images. B–E are enlargements of the proximal cut end, which is indicated by the boxed area in A. Bars (A), 200 μm; (B–E), 25 μm.
Figure 2.
Figure 2.
Restructuring of MTs after axotomy. (A–C) A B neuron was cultured for 4 h and microinjected with EB3-GFP mRNA. 1 h later, the neuron was bathed in RH237 for 30 min. The experiment began 16 h later by online imaging of the distribution of the EB3-GFP signal (A) and RH237-labeled vesicles (B) 3 μm above the substrate. Merged images of EB3-GFP (green) and RH237 (red) fluorescent signals are shown in C. Yellow arrows indicate the plus ends of the MTs as revealed by online imaging of the EB3-GFP signals. (A1) Before axonal transection (control; the site of axotomy is indicated by a white arrow), all of the MT plus ends point toward the tip of the axon. (B1) The RH237-labeled vesicles are distributed in the axoplasm. (C1) The merged image of A1 and B1. (A2) Axotomy leads within seconds to depolymerization of the MTs as indicated by dissipation of the EB3-GFP comet tail structures. (B2 and C2) Distribution of the RH237 fluorescence was unaltered. Within minutes of axotomy, the MTs repolymerize, and EB3-GFP reappears. However, in contrast to the control (A1), the plus ends of the MTs at the DZ point in various directions (arrows in A3). (B3) This is not associated with any noticeable change in the distribution of the RH237 signal. Within the next 10 min, the MTs reorient to form a plus end trap (boxed area in A4, which is enlarged in A7) and a minus end trap (boxed area in A5, which is enlarged in A8). The formation of the traps is associated with accumulation of the RH237 fluorescent signal mainly in the plus end trap (boxed area in B4, which is enlarged in B7) and, to a lesser extent, in the minus end trap (boxed area in B5, which is enlarged in B8). The corresponding merged images are shown in C4, C7, C5, and C8. The number of MTs that form the traps increases with time, as does the accumulation of RH237-labeled vesicles. Images were taken after axotomy as follows: A1–C1, control; A2–C2, 6 s; A3–C3, 1 min; A4–C4, 7 min; A5–C5, 9 min; A6–C6, 19 min. Bars (A1–C6), 10 μm; (A7–C8), 5 μm. Corresponds to Videos 1–3 (available at http://www.jcb.org/cgi/content/full/jcb.200607098/DC1).
Figure 3.
Figure 3.
Differential accumulation of anterogradely transported vesicles labeled by SNAP-25 and retrogradely transported vesicles labeled by the pinocytotic marker SR101. A B neuron was cultured for 4 h. To label membrane-bound organelles, the neuron was bathed in RH237 for 30 min. 24 h later and 4 h before the axon was transected, EYFP–SNAP-25 mRNA was microinjected into the neuron. To label endocytotic vesicles, the neuron was incubated for 20 min in SR101. Images taken 20 min after axotomy are shown. (A) The spatial distribution of RH237-labeled vesicles corresponds to the plus (+ET) and minus end (−ET) vesicle traps. (B) Anterogradely transported EYFP–SNAP-25 fluorescence concentrates in the region of the plus end trap and at the very tip of the axon. (C) Vesicles labeled by SR101 are retained in the DZ. (D) The merged image of EYFP–SNAP-25 (green) and SR101 fluorescence (red) demonstrates their differential accumulation in the plus and minus end traps, respectively. Bar, 15 μm.
Figure 4.
Figure 4.
Formation of the MT-based plus and minus end traps depends on the anterograde transport of component from the cell body to the axon. A B neuron was cultured for 4 h and microinjected with EB3-GFP. Approximately 17 h later, the neuron was injected with cherry–SNAP-25 mRNAs. (A1 and A2) 5 h later, the axon was transected (first transection), and the distribution of EB3-GFP and cherry–SNAP-25 were imaged. (B1–B3) Images taken 5 min after axonal transection 3 μm above the substrate are shown, which corresponds to the boxed area in A2. Arrows in B1 indicate plus ends of the MTs as revealed by EB3-GFP imaging. Note the formation of the plus end (+ET) and minus end traps (−ET). (B2) The cherry–SNAP-25 fluorescent signal concentrated within the plus end trap and at the tip of the axon. (B3) A merged image of B1 (green) and B2 (red). (C1–C3) 3 h after the first transection, the isolated axon was transected again (A3; second transection). The images were taken 18 min after the transection from an area corresponding to the box in A3. Note that even 1 h after axotomy, the MT polarity was unchanged (arrows in C1 indicate the plus ends), and the cherry–SNAP-25 fluorescent signal did not accumulate (C2). (C3) a merged image of C1 (green) and C2 (red). Bar, 20 μm. Corresponds to Videos 7 and 8 (available at http://www.jcb.org/cgi/content/full/jcb.200607098/DC1).
Figure 5.
Figure 5.
Formation of the MT-based plus and minus end traps cannot be correlated with retrogradely transported retrieved membrane. A B neuron was cultured for 4 h and microinjected with EB3-GFP mRNA. 18 h later, the neurons were incubated for 20 min in a solution containing the fluid-phase endocytotic marker SR101. The excess dye was washed away, and the axon was transected 1 h later, as shown in Fig. 4 (A1 and A2; first transection). (A) Imaging revealed that axotomy leads to formation of the plus and minus end traps (A1; +ET and −ET, respectively) and that SR101 concentrates in the minus end trap and is cleared away from the plus end trap and PZ by transport (A2). A3 is the merged image of A1 (green) and A2 (red). 3 h after the first transection, the isolated axon was exposed again to SR101 and transected (Fig. 4 A3; second transection). (B2) Note that the presence of vesicles that are carried retrogradely in the DZ is insufficient to induce the formation of the traps. The images in A were taken 10 min after the first transection, and those in B were taken 19 min after the second transection. Arrows in A1 and B1 indicate the plus ends of the MTs. Bar, 20 μm. Corresponds to Videos 9 and 10 (available at http://www.jcb.org/cgi/content/full/jcb.200607098/DC1).
Figure 6.
Figure 6.
Accumulation and fusion of Golgi-derived vesicles with the GCOC plasma membrane. A buccal neuron was cultured for 12 h and microinjected with superecliptic synaptopHluorin mRNA. 4.5 h later, the axon was transected, and the synaptopHluorin signal was imaged using 405- (A2, B2, and C2) and 488-nm (A1, B1, and C1) excitation lasers. A3, B3, and C3 are the merge images of A1, B1, and C1 (green) and A2, B2, and C2 (red). (A1–A3) 10 min after axotomy, the 405-nm signal accumulates within the GCOC. The 488-nm signal is detected within the GCOC domain and on the plasma membrane surrounding it. (B1–B3) Pressure ejection of acidic solution (pH 5.4) on to the GCOC caused a sharp drop of the 488-nm signal located on the plasma membrane but not within the GCOC. The 405-nm signal was not influenced by this procedure. (C1–C3) Upon termination of the application, the 488-nm signal recovered. The images were taken 3 μm above the substrate level. Bar, 15 μm.
Figure 7.
Figure 7.
Regeneration of the cut axonal end depends on the accumulation of Golgi-derived vesicles in the GCOC and not on retrieved retrogradely transported vesicles. 10 μl/ml BFA was added to the bathing solution of a B neuron. 15 h later, the neuron was injected with EYFP–SNAP-25 mRNA. 1 h before axonal transection, the neuron was exposed for 20 min to SR101 and was transected. Images were taken 3 μm above the substrate level from the boxed area indicated in A. (A) Transmitted light micrograph taken 40 min after axotomy shows that the axon failed to regenerate a GC's lamellipodium. (B) As indicated by the fluorescent signal, the injected EYFP–SNAP-25 mRNA was translated in the presence of BFA. Nevertheless, the signal was distributed along the axon rather than accumulating within the GCOC, as in the control experiments. This result is consistent with the fact that the Golgi apparatus disintegrates in the presence of BFA. (C) The SR101 fluorescent signal was retained within the DZ as in the control experiments. (D) A merge image of B (green) and C (red). B–D were taken 28 min after axotomy. Bars (A), 100 μm; (B–D) 20 μm.
Figure 8.
Figure 8.
Diagrammatic summary of the structural events leading to the formation of MT-based plus and minus end vesicle traps after axotomy. (A) In intact neurons, the MTs orient their plus end distally (arrows) toward the tip of the axon. Anterograde (blue) and retrograde (red) vesicles are transported along the MTs. (B) Axotomy leads to a calcium-dependent retrograde wave of MT depolymerization along a neuronal segment of ∼50–100 μm (yellow gradient). Concomitantly, the vectorial motion of transported vesicles along the distal segment stops. The MT depolymerization wave ends when the free intraaxonal calcium concentration recovers to its resting level. (C) This is followed within minutes of axotomy by repolymerization of the MTs in two forms: a directional anterograde wave of MT repolymerization from the PZ toward the DZ (dashed arrow) and repolymerization of MTs in all directions in the distal segment of the cut axon (DZ). (D) Within minutes, the polarity of the MTs is restructured: in the PZ, all MTs point their plus ends anterogradely. Retrogradely transported vesicles (red) continue their journey and, thus, are cleared away from this region. In contrast, the vectorial transport of plus end–driven vesicles continues, and the anterogradely driven vesicle concentration increases at this interface. (D and E) Distal to it and in relation to the local concentration of anterogradely transported vesicles, the orientation of the MTs reverses such that the plus ends point retrogradely. (D) This reversal of MT orientation creates the narrow GCOC, which is bordered both proximally and distally by the MT plus ends. Distal to the GCOC, the MT plus ends point toward the plasma membrane at the tip of the cut axon or are aligned in parallel and close to the plasma membrane. This MT orientation forms a second zone, which is bordered by the minus end of the MTs. This MT configuration traps in the center minus end–driven vesicles (red) and sends away toward the very tip of the axon vesicles that are driven by plus end–oriented motors (D, blue). (E) With time, the structure becomes more robust, and the subdivision to PZ, GCOC, and DZ becomes more visible.

Similar articles

Cited by

References

    1. Ahmad, F.J., Y. He, K.A. Myers, T.P. Hasaka, F. Francis, M.M. Black, and P.W. Baas. 2006. Effects of dynactin disruption and dynein depletion on axonal microtubules. Traffic. 7:524–537. - PubMed
    1. Akhmanova, A., and C.C. Hoogenraad. 2005. Microtubule plus-end-tracking proteins: mechanisms and functions. Curr. Opin. Cell Biol. 17:47–54. - PubMed
    1. Allan, V., and I.S. Nathke. 2001. Catch and pull a microtubule: getting a grasp on the cortex. Nat. Cell Biol. 3:E226–E228. - PubMed
    1. Ashery, U., R. Penner, and M.E. Spira. 1996. Acceleration of membrane recycling by axotomy of cultured Aplysia neurons. Neuron. 16:641–651. - PubMed
    1. Bananis, E., J.W. Murray, R.J. Stockert, P. Satir, and A.W. Wolkoff. 2000. Microtubule and motor-dependent endocytic vesicle sorting in vitro. J. Cell Biol. 151:179–186. - PMC - PubMed

Publication types