Comparative Study
. 2007 Feb 19;204(2):273-83.
doi: 10.1084/jem.20062175. Epub 2007 Feb 5.

Conventional T-bet(+)Foxp3(-) Th1 cells are the major source of host-protective regulatory IL-10 during intracellular protozoan infection

Affiliations
Comparative Study

Conventional T-bet(+)Foxp3(-) Th1 cells are the major source of host-protective regulatory IL-10 during intracellular protozoan infection

Dragana Jankovic et al. J Exp Med. .

Abstract

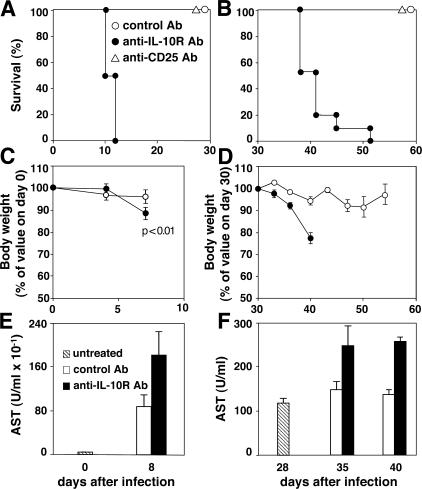
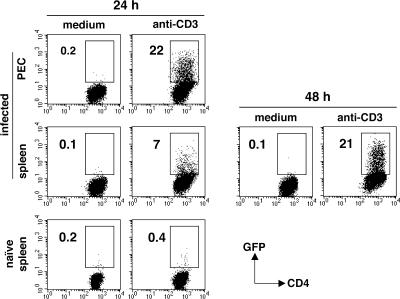
Although interferon gamma (IFN-gamma) secretion is essential for control of most intracellular pathogens, host survival often also depends on the expression of interleukin 10 (IL-10), a cytokine known to counteract IFN-gamma effector functions. We analyzed the source of regulatory IL-10 in mice infected with the protozoan parasite Toxoplasma gondii. Unexpectedly, IFN-gamma-secreting T-bet(+)Foxp3(-) T helper type 1 (Th1) cells were found to be the major producers of IL-10 in these animals. Further analysis revealed that the same IL-10(+)IFN-gamma(gamma) population displayed potent effector function against the parasite while, paradoxically, also inducing profound suppression of IL-12 production by antigen-presenting cells. Although at any given time point only a fraction of the cells appeared to simultaneously produce IL-10 and IFN-gamma, IL-10 production could be stimulated in IL-10(-)IFN-gamma(+) cells by further activation in vitro. In addition, experiments with T. gondii-specific IL-10(+)IFN-gamma(+) CD4 clones revealed that although IFN-gamma expression is imprinted and triggered with similar kinetics regardless of the state of Th1 cell activation, IL-10 secretion is induced more rapidly from recently activated than from resting cells. These findings indicate that IL-10 production by CD4(+) T lymphocytes need not involve a distinct regulatory Th cell subset but can be generated in Th1 cells as part of the effector response to intracellular pathogens.


Figures

Figure 1.
Figure 1.
IL-10R signaling is required for host survival during both acute and chronic infection with an avirulent strain of T. gondii. WT mice inoculated i.p. with 20 ME-49 cysts were treated with control (open circles; n = 10), anti–IL-10R (closed circles; n = 10), or anti-CD25 (open triangles; n = 10) mAbs either at days −2 and +2 (A, C, and E) or at days +28, 30, and 33 (B, D, and F). Survival (A and B) and body weight (C and D) of the infected mice was then monitored. In addition, levels of hepatic ASTs (E and F) were measured in sera of individual mice before (hatched bars) or after treatment with the control (open bars) or anti–IL-10R (shaded bars) mAbs. The results shown represent the mean ± SD for each group. Comparable results were obtained in two additional experiments.
Figure 2.
Figure 2.
Serum cytokine levels in T. gondii–infected mice treated with anti–IL-10R mAb in the presence or absence of concurrent CD4 T cell depletion. Uninfected or infected mice treated on days −2 and +2 relative to the time of infection with control mAb, anti–IL-10R mAb, anti–IL-10R plus anti-CD4 mAb, or anti-CD4 mAb only were bled on day 8 after infection. Serum concentrations of IL-12, IFN-γ, and IL-10 were measured by ELISA. Bars represent the mean ± SEM of the cytokine levels in three to five mice per group from one representative of two experiments performed. *, P < 0.05; **, P < 0.01; NS, P = 0.2.
Figure 3.
Figure 3.
Transfer of IL-10+/+, but not IL-10−/−, CD4+ cells down-regulates IL-12 production in vivo and promotes survival of T. gondii–infected RAG × IL-10 KO mice. 15 × 106 MACS-purified CD4 cells from either WT or IL-10 KO naive mice were adoptively transferred into RAG × IL-10 KO recipients. 7 d later, reconstituted (n = 5) and nonreconstituted (n = 4) RAG × IL-10 KO animals were inoculated i.p. with 20 pepsin-treated ME-49 cysts. (A) Mice were bled on day 8 after infection, and serum concentrations of IL-12 and IFN-γ were measured by ELISA. (B) Cumulative survival of each group of animals. The data shown are the pooled results from two independent experiments. *, P < 0.002; **, P < 0.001; NS, P = 0.3.
Figure 4.
Figure 4.
Phenotypic analysis of IL-10– and IFN-γ–producing CD4+ T lymphocytes derived from mice chronically infected with T. gondii. Mice were inoculated with T. gondii cysts, and spleen cells were recovered at different time points after infection. (A) IFN-γ and IL-10 production by bulk splenocytes 72 h after restimulation with STAg. The values shown are the means ± SD of the cytokine concentration in culture supernatants from three mice per group. (B) Proliferative and IFN-γ/IL-10 responses of FACS-sorted CD4+ T lymphocytes from week 6–infected mice. Total CD4+ T cells or the indicated cell subpopulations were purified and restimulated with STAg in the presence of irradiated APCs, and thymidine incorporation and cytokine production were measured at 48 and 72 h, respectively. The values shown are the means ± SD of duplicate assays performed on cells pooled from three donors. (C) IL-10 and IFN-γ intracellular staining profiles of the same total CD4+ and CD4+CD25 subpopulations shown in B after additional restimulation with PMA/ionomycin. The dot plots shown were gated on CD4+ cells. The results shown in each panel are representative of three experiments performed.
Figure 5.
Figure 5.
Phenotypic analysis of IL-10– and IFN-γ–producing CD4+ T lymphocytes freshly isolated from mice with acute T. gondii infection. Peritoneal and spleen lymphocytes were recovered from day 7–infected and uninfected control mice. (A) IL-10 and IFN-γ ICS of these populations (pooled from three animals) after restimulation for 5 h with anti-CD3 mAb. The dot plots shown were gated on CD4+ cells and are representative of five experiments performed. (B) Frequency of Foxp3+ or T-bet+ CD4+ T lymphocytes in the spleen and peritoneum of naive versus day 7–infected mice. Bars represent the mean ± SD of assays on the individual animals (n = 3–5). (C) T-bet versus IL-10 expression in peritoneal IFN-γ+ CD4+ T cells recovered from infected mice and restimulated as in A. (D) Frequency of peritoneal IL-10+ CD4+ T lymphocytes within the IFN-γ+T-bet+ and IFN-γT-bet populations in naive versus day 7–infected mice. Bars represent the mean ± SD of assays on the individual animals (n = 3). The data shown in C and D are representative of three experiments performed.
Figure 6.
Figure 6.
Dual effector and regulatory functions of T. gondii–induced IL-10+IFN-γ+ CD4 T lymphocytes. CD4+CD44+ GFP and CD4+CD44+ GFP+ lymphocytes were purified by FACS from spleens of day 7–infected IL-10 GFP knock-in tiger mice (A) and cultured at the indicated numbers with T. gondii–infected IL-10–deficient peritoneal macrophages. (B) At 24 h, supernatants were removed, [5,6-3H]Uracil was added for an additional 18 h, and isotope incorporation was measured as an index of parasite growth. Levels of IFN-γ and IL-10 were measured in culture supernatants by specific ELISA and NO quantitated by the Griess reaction. (C) In one set of cultures, control or anti–IL-10R mAb was added at the initiation of the experiment, and levels of IL-12p40 were measured in 24-h culture supernatants. Each data point is the mean of measurements performed on duplicate cultures (SD < 10%). The exp eriment shown in B is representative of three performed; the experiment in C is representative of two performed.
Figure 7.
Figure 7.
In vitro induction of IL-10 expression in IL-10 CD4+ T cells from infected mice. CD4+CD44+ GFP lymphocytes were purified by FACS from peritoneum and spleen of day 7–infected IL-10 GFP knock-in tiger mice (n = 2–3) and cultured in medium alone or in the presence of anti-CD3 mAb. Control cultures consisted of anti-CD3–stimulated CD4+ T cells isolated from uninfected tiger mice. Induction of GFP expression was examined at 24 h after initiation of cultures and at 48 h for splenic population from infected animals. The results shown are representative of two experiments performed.
Figure 8.
Figure 8.
Distinct kinetics of IL-10 and IFN-γ secretion by T. gondiispecific CD4+ T cell clones. IL-10+IFN-γ+ T. gondii Ag-specific clones (D 36, B 71, or Clone 2; 2 × 10⁶ clones/ml) either in a rested state (28 d after last exposure to Ag) or recently activated (3 or 7 d after exposure to Ag/APC) were stimulated with PMA/inonomycin, and their production of IL-10 and IFN-γ was monitored. (A) ICS was performed after 4.5 h of PMA/inonomycin stimulation. The dot plots shown were gated on CD4+ T cells. (B) Levels of IL-10 and IFN-γ were measured in the culture supernatants at 6, 12, 24, and 48 h after PMA/inonomycin stimulation. No further increase in either cytokine was detected at 72 h. The amount of cytokine detected at each time point is expressed as the percentage of the amount detected at the 48-h plateau time point (resting cells, IFN-γ = 211 ± 9.6 ng/ml and IL-10 = 22.6 ± 0.6 ng/ml; reactivated cells, IFN-γ = 911 ± 17.9 ng/ml and IL-10 = 115.4 ± 0.9 ng/ml). The results shown in each panel are representative of two experiments performed.

References

    1. Gajewski, T.F., and F.W. Fitch. 1988. Anti-proliferative effect of IFN-γ in immune regulation. I. IFN-γ inhibits the proliferation of Th2 but not Th1 murine helper T lymphocyte clones. J. Immunol. 140:4245–4252. - PubMed
    1. Fiorentino, D.F., M.W. Bond, and T.R. Mosmann. 1989. Two types of mouse T helper cell. IV. Th2 clones secrete a factor that inhibits cytokine production by Th1 clones. J. Exp. Med. 170:2081–2095. - PMC - PubMed
    1. Abbas, A.K., K.M. Murphy, and A. Sher. 1996. Functional diversity of helper T lymphocytes. Nature. 383:787–793. - PubMed
    1. Sakaguchi, S., N. Sakaguchi, M. Asano, M. Itoh, and M. Toda. 1995. Immunologic self-tolerance maintained by activated T cells expressing IL-2 receptor α-chains (CD25). Breakdown of a single mechanism of self-tolerance causes various autoimmune diseases. J. Immunol. 155:1151–1164. - PubMed
    1. Kretschmer, K., I. Apostolou, D. Hawiger, K. Khazaie, M.C. Nussenzweig, and H. von Boehmer. 2005. Inducing and expanding regulatory T cell populations by foreign antigen. Nat. Immunol. 6:1219–1227. - PubMed

Publication types