

Identification of prostate cancer mRNA markers by averaged differential expression and their detection in biopsies, blood, and urine
- PMID: 17283334
- PMCID: PMC1892964
- DOI: 10.1073/pnas.0610504104
Identification of prostate cancer mRNA markers by averaged differential expression and their detection in biopsies, blood, and urine
Abstract
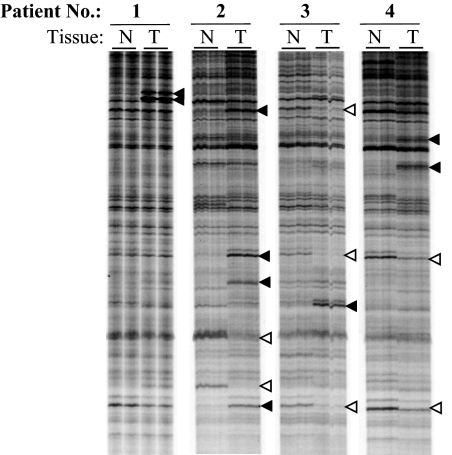
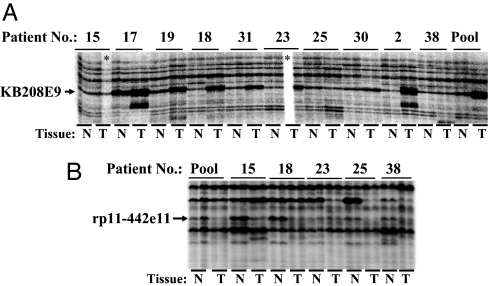
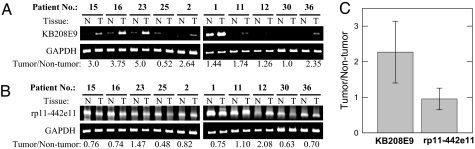
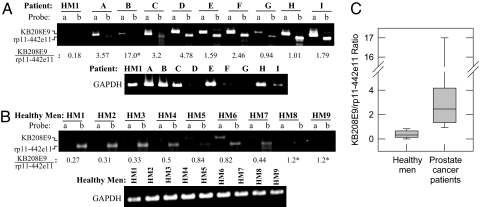
The advent of serum prostate-specific antigen (PSA) as a biomarker has enabled early detection of prostate cancer and, hence, improved clinical outcome. However, a low PSA is not a guarantee of disease-free status, and an elevated PSA is frequently associated with a negative biopsy. Therefore, our goal is to identify molecular markers that can detect prostate cancer with greater specificity in body fluids such as urine or blood. We used the RT-PCR differential display method to first identify mRNA transcripts differentially expressed in tumor vs. patient-matched nontumor prostate tissue. This analysis led to the identification of 44 mRNA transcripts that were expressed differentially in some but not all tumor specimens examined. To identify mRNA transcripts that are differentially expressed in most tumor specimens, we turned to differential display of pooled tissue samples, a technique we name averaged differential expression (ADE). We performed differential display of mRNA from patient-matched nontumor vs. tumor tissue, each pooled from 10 patients with various Gleason scores. Differentially expressed mRNA transcripts identified by ADE were fewer in number, but were expressed in a greater percentage of tumors (>75%) than those identified by differential display of mRNA from individual patient samples. Differential expression of these mRNA transcripts was also detected by RT-PCR in mRNA isolated from urine and blood samples of prostate cancer patients. Our findings demonstrate the principle that specific cDNA probes of frequently differentially expressed mRNA transcripts identified by ADE can be used for the detection of prostate cancer in urine and blood samples.
Conflict of interest statement
The authors declare no conflict of interest.
Figures
Similar articles
-
Gene expression profiles in prostate cancer: identification of candidate non-invasive diagnostic markers.Actas Urol Esp. 2014 Apr;38(3):143-9. doi: 10.1016/j.acuro.2013.07.012. Epub 2013 Oct 25. Actas Urol Esp. 2014. PMID: 24206626 English, Spanish.
-
Detection of alpha-methylacyl-coenzyme-A racemase transcripts in blood and urine samples of prostate cancer patients.Mol Diagn Ther. 2006;10(6):397-403. doi: 10.1007/BF03256217. Mol Diagn Ther. 2006. PMID: 17154657
-
A Panel of Biomarkers for Diagnosis of Prostate Cancer Using Urine Samples.Anticancer Res. 2018 Mar;38(3):1471-1477. doi: 10.21873/anticanres.12373. Anticancer Res. 2018. PMID: 29491074
-
Reverse transcriptase polymerase chain reaction for prostate specific antigen in the management of prostate cancer.J Urol. 1997 Aug;158(2):326-37. J Urol. 1997. PMID: 9224297 Review.
-
New targets for therapy in prostate cancer: differential display code 3 (DD3(PCA3)), a highly prostate cancer-specific gene.Urology. 2003 Nov;62(5 Suppl 1):34-43. doi: 10.1016/s0090-4295(03)00759-3. Urology. 2003. PMID: 14607216 Review.
Cited by
-
Androgen receptor interacts with telomeric proteins in prostate cancer cells.J Biol Chem. 2010 Apr 2;285(14):10472-6. doi: 10.1074/jbc.M109.098798. Epub 2010 Jan 28. J Biol Chem. 2010. PMID: 20110352 Free PMC article.
-
Castration-resistant prostate cancer: Androgen receptor inactivation induces telomere DNA damage, and damage response inhibition leads to cell death.PLoS One. 2019 May 13;14(5):e0211090. doi: 10.1371/journal.pone.0211090. eCollection 2019. PLoS One. 2019. PMID: 31083651 Free PMC article.
-
Hydrazinobenzoylcurcumin inhibits androgen receptor activity and growth of castration-resistant prostate cancer in mice.Oncotarget. 2015 Mar 20;6(8):6136-50. doi: 10.18632/oncotarget.3346. Oncotarget. 2015. PMID: 25704883 Free PMC article.
-
Protein-directed synthesis of highly monodispersed, spherical gold nanoparticles and their applications in multidimensional sensing.Sci Rep. 2016 Jun 29;6:28900. doi: 10.1038/srep28900. Sci Rep. 2016. PMID: 27353703 Free PMC article.
-
Candidate serum biomarkers for prostate adenocarcinoma identified by mRNA differences in prostate tissue and verified with protein measurements in tissue and blood.Clin Chem. 2012 Mar;58(3):599-609. doi: 10.1373/clinchem.2011.171637. Epub 2012 Jan 12. Clin Chem. 2012. PMID: 22247499 Free PMC article.
References
-
- Mazzucchelli R, Colanzi P, Pomante R, Muzzonigro G, Montironi R. Adv Clin Pathol. 2000;4:111–120. - PubMed
-
- Schamhart DH, Maiazza R, Kurth KH. Int J Oncol. 2005;26:565–577. - PubMed
-
- Thompson IM, Pauler DK, Goodman PJ, Tangen CM, Lucia MS, Parnes HL, Minasian LM, Ford LG, Lippman SM, Crawford ED, et al. N Engl J Med. 2004;350:2239–2246. - PubMed
-
- Liang P, Pardee AB. Mol Biotechnol. 1998;10:261–267. - PubMed
Publication types
MeSH terms
Substances
Associated data
- Actions
- Actions
- Actions
- Actions
- Actions
- Actions
- Actions
- Actions
- Actions
- Actions
- Actions
- Actions
- Actions
- Actions
- Actions
- Actions
- Actions
- Actions
- Actions
- Actions
- Actions
- Actions
- Actions
- Actions
- Actions
- Actions
- Actions
- Actions
- Actions
- Actions
- Actions
- Actions
- Actions
- Actions
- Actions
- Actions
- Actions
- Actions
- Actions
- Actions
- Actions
- Actions
- Actions
- Actions
- Actions
Grants and funding
LinkOut - more resources
Full Text Sources
Other Literature Sources
Medical
Research Materials
Miscellaneous
