

Protection against inflammation- and autoantibody-caused fetal loss by the chemokine decoy receptor D6
- PMID: 17283337
- PMCID: PMC1892950
- DOI: 10.1073/pnas.0607514104
Protection against inflammation- and autoantibody-caused fetal loss by the chemokine decoy receptor D6
Abstract
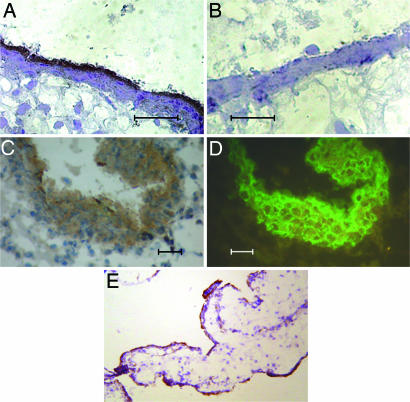
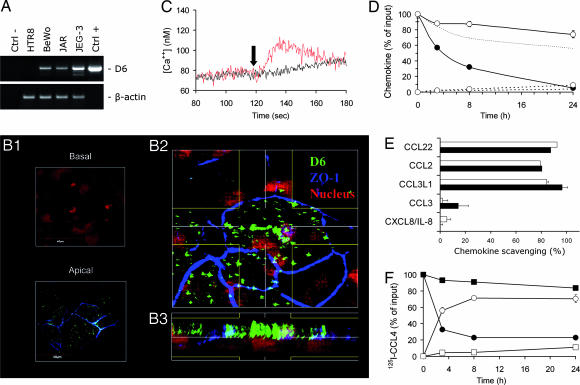
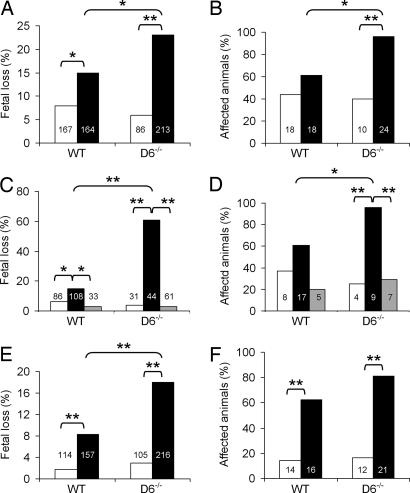
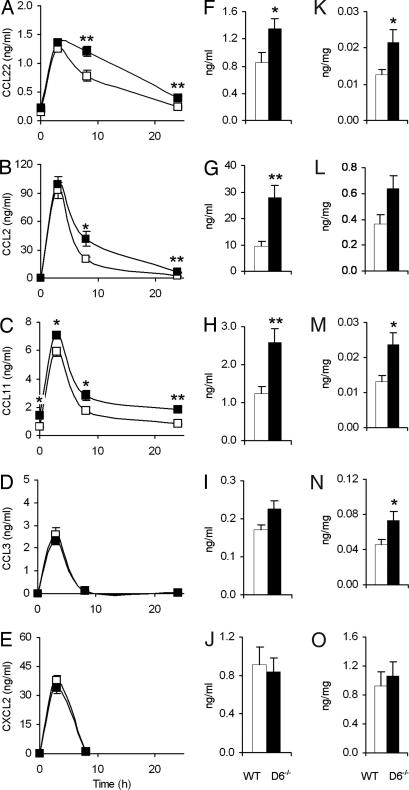
Fetal loss in animals and humans is frequently associated with inflammatory conditions. D6 is a promiscuous chemokine receptor with decoy function, expressed in lymphatic endothelium, that recognizes and targets to degradation most inflammatory CC chemokines. Here, we report that D6 is expressed in placenta on invading extravillous trophoblasts and on the apical side of syncytiotrophoblast cells, at the very interface between maternal blood and fetus. Exposure of D6-/- pregnant mice to LPS or antiphospholipid autoantibodies results in higher levels of inflammatory CC chemokines and increased leukocyte infiltrate in placenta, causing an increased rate of fetal loss, which is prevented by blocking inflammatory chemokines. Thus, the promiscuous decoy receptor for inflammatory CC chemokines D6 plays a nonredundant role in the protection against fetal loss caused by systemic inflammation and antiphospholipid antibodies.
Conflict of interest statement
The authors declare no conflict of interest.
Figures
Similar articles
-
Increased inflammation in mice deficient for the chemokine decoy receptor D6.Eur J Immunol. 2005 May;35(5):1342-6. doi: 10.1002/eji.200526114. Eur J Immunol. 2005. PMID: 15789340
-
The lymphatic system controls intestinal inflammation and inflammation-associated Colon Cancer through the chemokine decoy receptor D6.Gut. 2010 Feb;59(2):197-206. doi: 10.1136/gut.2009.183772. Epub 2009 Oct 20. Gut. 2010. PMID: 19846409
-
The chemoattractant decoy receptor D6 as a negative regulator of inflammatory responses.Biochem Soc Trans. 2006 Dec;34(Pt 6):1014-7. doi: 10.1042/BST0341014. Biochem Soc Trans. 2006. PMID: 17073740
-
Silent chemoattractant receptors: D6 as a decoy and scavenger receptor for inflammatory CC chemokines.Cytokine Growth Factor Rev. 2005 Dec;16(6):679-86. doi: 10.1016/j.cytogfr.2005.05.003. Epub 2005 Jul 5. Cytokine Growth Factor Rev. 2005. PMID: 15996892 Review.
-
Inflammatory reaction and implantation: the new entries PTX3 and D6.Placenta. 2008 Oct;29 Suppl B:129-34. doi: 10.1016/j.placenta.2008.06.008. Epub 2008 Aug 3. Placenta. 2008. PMID: 18676013 Review.
Cited by
-
Single-cell RNA-seq reveals cell type-specific transcriptional signatures at the maternal-foetal interface during pregnancy.Nat Commun. 2016 Apr 25;7:11414. doi: 10.1038/ncomms11414. Nat Commun. 2016. PMID: 27108815 Free PMC article.
-
Cutting edge: rapid accumulation of epidermal CCL27 in skin-draining lymph nodes following topical application of a contact sensitizer recruits CCR10-expressing T cells.J Immunol. 2008 May 15;180(10):6462-6. doi: 10.4049/jimmunol.180.10.6462. J Immunol. 2008. PMID: 18453562 Free PMC article.
-
Immunologic regulation in pregnancy: from mechanism to therapeutic strategy for immunomodulation.Clin Dev Immunol. 2012;2012:258391. doi: 10.1155/2012/258391. Epub 2011 Nov 3. Clin Dev Immunol. 2012. PMID: 22110530 Free PMC article. Review.
-
The scavenging chemokine receptor ACKR2 has a significant impact on acute mortality rate and early lesion development after traumatic brain injury.PLoS One. 2017 Nov 27;12(11):e0188305. doi: 10.1371/journal.pone.0188305. eCollection 2017. PLoS One. 2017. PMID: 29176798 Free PMC article.
-
Selective expression and significance of ACKR2 in lung aerocytes.J Immunother Cancer. 2025 Jan 21;13(1):e009467. doi: 10.1136/jitc-2024-009467. J Immunother Cancer. 2025. PMID: 39843164 Free PMC article.
References
-
- Luster AD. N Engl J Med. 1998;338:436–445. - PubMed
-
- Murphy PM. Annu Rev Immunol. 1994;12:593–633. - PubMed
-
- Murphy PM, Baggiolini M, Charo IF, Hebert CA, Horuk R, Matsushima K, Miller LH, Oppenheim JJ, Power CA. Pharmacol Rev. 2000;52:145–176. - PubMed
-
- Locati M, Martinez de la Torre Y, Galliera E, Bonecchi R, Bodduluri H, Vago G, Vecchi A, Mantovani A. Cytokine Growth Factor Rev. 2005;16:679–686. - PubMed
-
- Mantovani A, Bonecchi R, Locati M. Nat Rev Immunol. 2006;12:907–918. - PubMed
Publication types
MeSH terms
Substances
LinkOut - more resources
Full Text Sources
Other Literature Sources
Molecular Biology Databases
