. 2006 Nov;12(11):1671-81.
doi: 10.3201/eid1211.060255.

Targeted social distancing design for pandemic influenza

Affiliations

Targeted social distancing design for pandemic influenza

Robert J Glass et al. Emerg Infect Dis. 2006 Nov.

Abstract

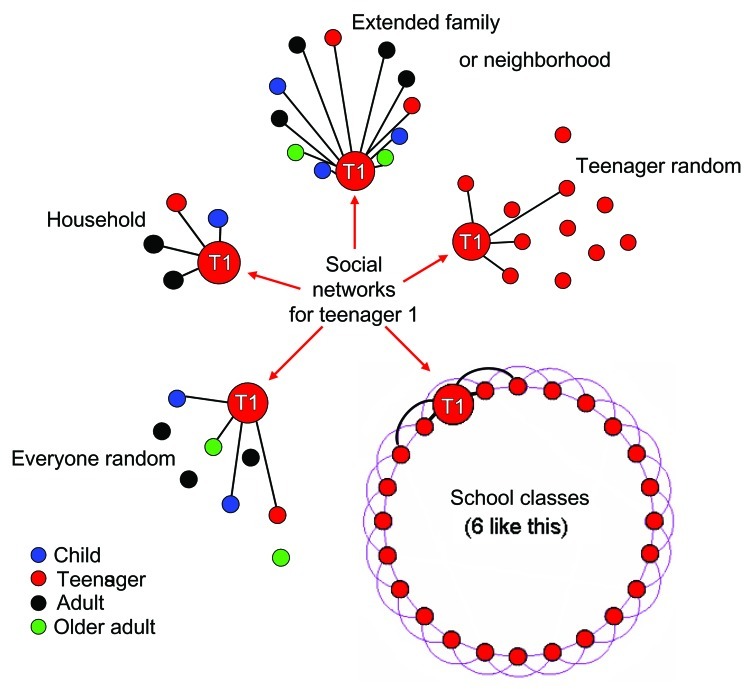
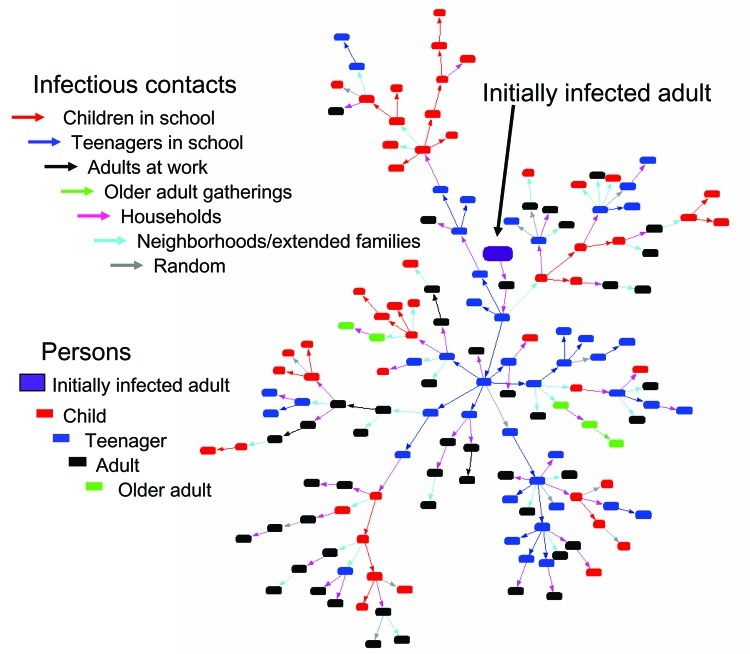
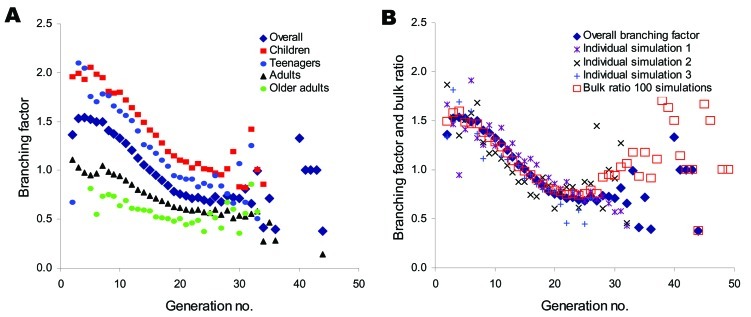
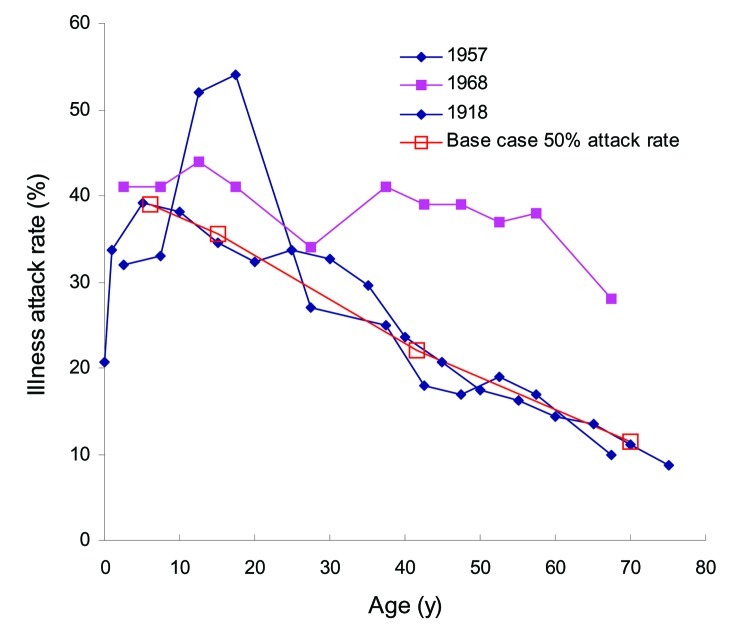
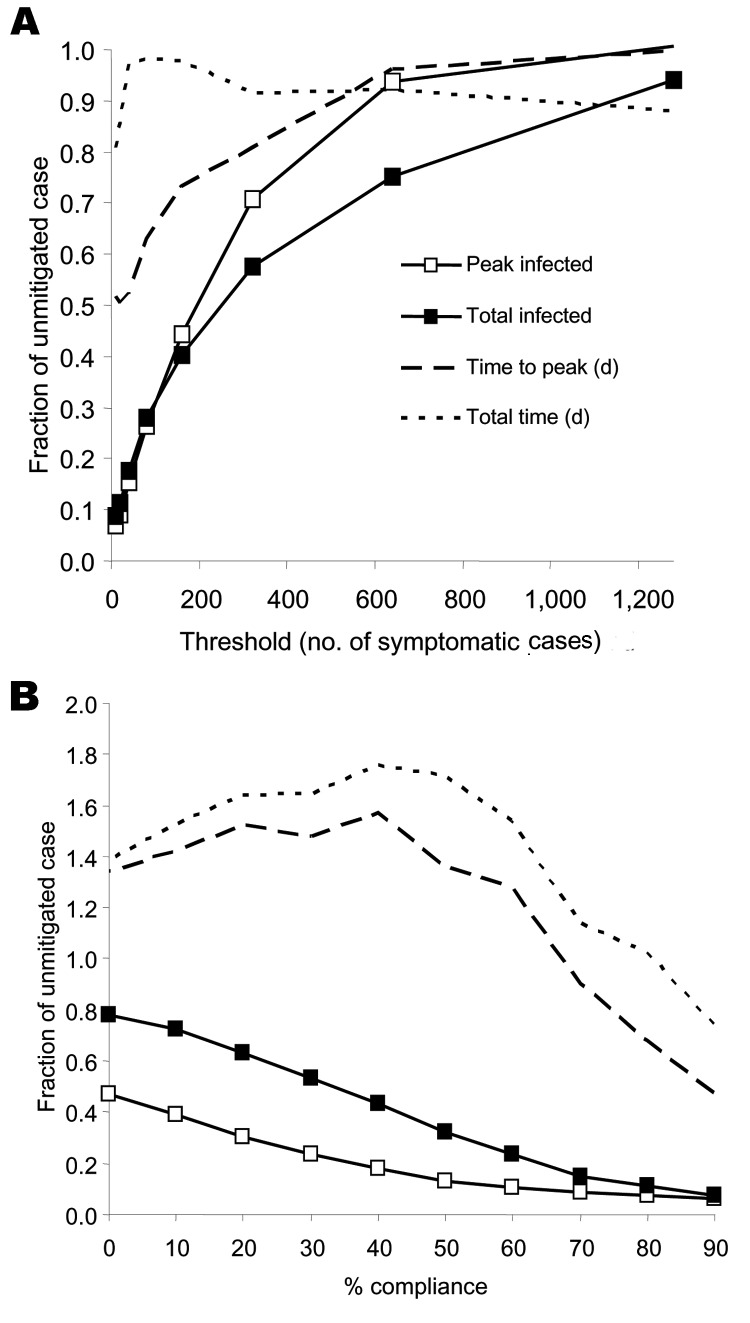
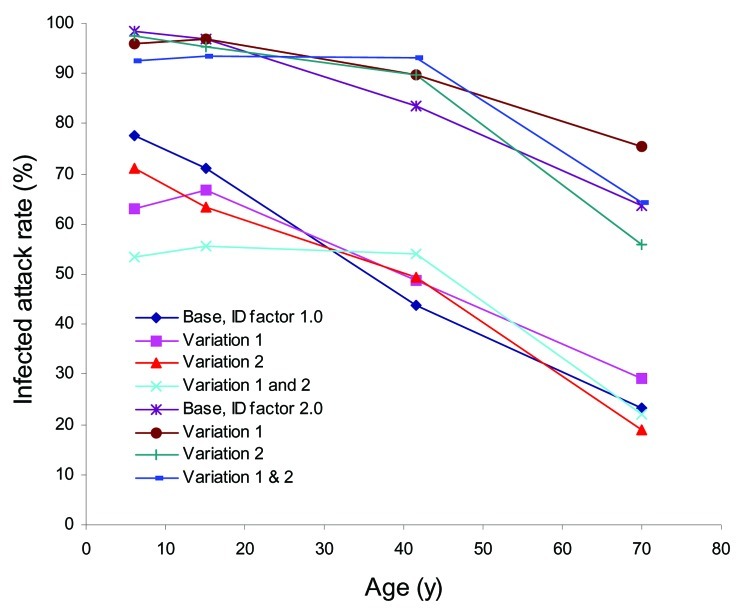
Targeted social distancing to mitigate pandemic influenza can be designed through simulation of influenza's spread within local community social contact networks. We demonstrate this design for a stylized community representative of a small town in the United States. The critical importance of children and teenagers in transmission of influenza is first identified and targeted. For influenza as infectious as 1957-58 Asian flu (=50% infected), closing schools and keeping children and teenagers at home reduced the attack rate by >90%. For more infectious strains, or transmission that is less focused on the young, adults and the work environment must also be targeted. Tailored to specific communities across the world, such design would yield local defenses against a highly virulent strain in the absence of vaccine and antiviral drugs.


Figures

Figure 1
Figure 1
Typical groups and person-to-person links for model teenager. The teenager (T1) belongs to a household (fully connected network, mean link contact frequency 6/day), an extended family or neighborhood (fully connected network, mean link contact frequency 1/day), and 6 school classes (ring network with connections to 2 other teenagers on each side as shown in black; purple links denote connections of other teenagers within the class; mean link contact frequency 1/day). Two random networks are also imposed, 1 within the age group (teenager random, average of 3 links/teenager, mean link contact frequency of 1/day), and 1 across all age groups (overall random average of 25 links/person [not all links shown], mean link contact frequency of 0.04/day).
Figure 2
Figure 2
Natural history of influenza in our model. Duration of each state for a given person is chosen from an exponential distribution. State relative infectivity (IR) and mean state duration were chosen to reflect the infectivity variation of Ferguson et al. (10,11) (see Figure 3). Transition probabilities between presymptomatic and postsymptomatic states are also noted. For symptomatic persons who stay at home, link frequencies outside the household are reduced by 90%.
Figure 3
Figure 3
Functional behavior of IR with time. Although infectivity of an asymptomatic person is constant with time (IR 0.25), infectivity of a symptomatic person changes from infectious presymptomatic (IR 0.25) to early infectious symptomatic (IR 1.0) to late symptomatic (IR 0.375). A symptomatic person with mean state periods as denoted in Figure 2 is shown in gray (asymptomatic with dashed line). Because state periods are different for each person (given by exponential distributions) and half of the infected persons are asymptomatic, the average population scale IR in time is smoothed as shown in blue. Both disease state periods and IR values were chosen to honor the clinically derived natural history of influenza (14), selected viral shedding data shown as open red squares (15), and the model of Ferguson et al. (10,11).
Figure 4
Figure 4
Initial growth of an infectious contact network. Colored rectangles denote persons of designated age class, and colored arrows denote groups within which the infectious transmission takes place. In this example, from the adult initial seed (large purple rectangle), 2 household contacts (light purple arrows) bring influenza to the middle or high school (blue arrows) where it spreads to other teenagers. Teenagers then spread influenza to children in households who spread it to other children in the elementary schools. Children and teenagers form the backbone of the infectious contact network and are critical to its spread; infectious transmissions occur mostly in the household, neighborhood, and schools.
Figure 5
Figure 5
Branching factor and the approximation of the reproductive number Ro. A) Overall and age class–specific branching factors as a function of generation averaged over 100 simulations. The standard deviations of these averages can be large (<0.72 at the peak value for teenagers) and reflect the heterogeneity within the person contact networks and from community to community. B) Branching factors for overall average and 3 example simulations compared with the bulk ratio of infections in a generation to those in the previous generation pooled across 100 simulations. We chose the maximum value of the bulk ratio (1.6) as an approximation of the reproductive number Ro.
Figure 6
Figure 6
Comparison of simulated age class–specific illness attack rates with past pandemics. Simulated illness attack rates (half the infectious attack rate) for the unmitigated base case are close to those found in studies of historic pandemics in 1957 (19), 1968 (20), and 1918 (21). Notable differences are the 1968 Hong Kong flu, which had less effect on youth and 1957–58 Asian flu, which had greater effect; however, historic data are inherently uncertain. Closer correspondence to either of these 2 cases could be achieved through changes in IA or SA or modification of the underlying social contact network (see Results) because the network was likely different from that of a small town of today.
Figure 7
Figure 7
Fraction of unmitigated base case attack rate for targeted social distancing of children and teenagers as a function of A) implementation policy threshold given by the number of symptomatic cases (compliance at 90%) and B) compliance with staying at home (implementation policy threshold at 10 symptomatic cases, 0% compliance closes schools alone). Each point represents the average of simulations of 100 that yielded epidemics (>100 infected). Standard deviations for variation of threshold are <3% of the total population. However, for compliance variation, standard deviations increase to a maximum of 7% of the total population at a compliance of 30%.
Figure 8
Figure 8
Unmitigated age-specific attack rate results for disease infectivity (ID) factors of 1.0 and 2.0 and base case, variation 1 (removal of relative infectivity and susceptibility), variation 2 (increase in work group frequency of contact to give all children, teenagers, and adults the same overall contact frequencies), and variations 1 and 2 combined. Illness attack rates shown in Figure 6 are half these values.

Similar articles

Cited by

References

    1. World Health Organization. Avian influenza frequently asked questions. Geneva: The Organization; 2005. - PubMed
    1. Check E. Avian flu special: is this our best shot? Nature. 2005;435:404–6. 10.1038/435404a - DOI - PubMed
    1. US Homeland Security Council. National strategy for pandemic influenza: implementation plan. Washington: US Department of Homeland Security; 2006.
    1. US Department of Health and Human Services. Pandemic influenza plan HHS. Washington: The Department; 2005.
    1. Glass RJ, Glass LM, Beyeler WE. Local mitigation strategies for pandemic influenza: prepared for the Department of Homeland Security under the National Infrastructure Simulation and Analysis Center. Report no. SAND2005–7955J. Washington: Department of Homeland Security; 2005.

Publication types

LinkOut - more resources