

Overexpression of caveolin-1 in a human melanoma cell line results in dispersion of ganglioside GD3 from lipid rafts and alteration of leading edges, leading to attenuation of malignant properties
- PMID: 17284246
- PMCID: PMC11159806
- DOI: 10.1111/j.1349-7006.2007.00419.x
Overexpression of caveolin-1 in a human melanoma cell line results in dispersion of ganglioside GD3 from lipid rafts and alteration of leading edges, leading to attenuation of malignant properties
Abstract
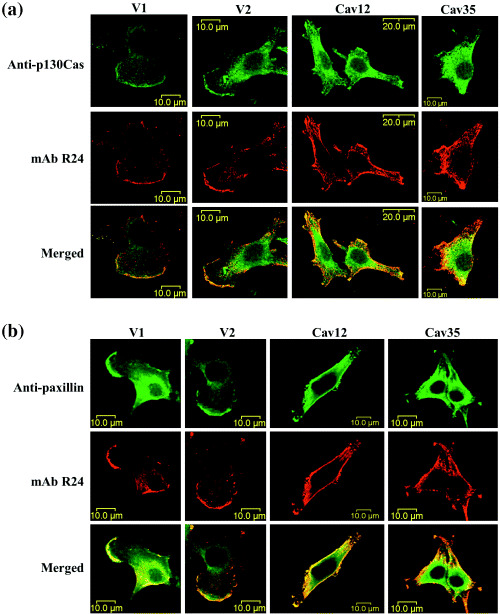
Caveolin-1 is a component of lipid rafts, and is considered to be a tumor suppressor molecule. However, the mechanisms by which caveolin-1 functions in cancer cells are not well understood. We generated caveolin-1 transfectant cells (Cav-1(+) cells) using a human melanoma cell line (SK-MEL-28) and investigated the effects of caveolin-1 overexpression on the GD3-mediated malignant properties of melanomas. Cav-1(+) cells had decreased cell growth and motility, and reduced phosphorylation levels of p130Cas and paxillin relative to controls. In floatation analysis, although GD3 was mainly localized in glycolipid-enriched microdomain (GEM)/rafts in control cells, it was dispersed from GEM/rafts in Cav-1(+) cells. Correspondingly, GD3 in Cav-1(+) cells stained uniformly throughout the membrane, whereas control cells showed partial staining of the membrane, probably at the leading edge. p130Cas and paxillin were stained in the leading edges and colocalized with GD3 in the control cells. In contrast, these molecules were diffusely stained and no definite leading edges were detected in Cav-1(+) cells. These results suggest that caveolin-1 regulates GD3-mediated malignant signals by altering GD3 distribution and leading edge formation. These results reveal one of the mechanisms by which caveolin-1 curtails the malignant properties of tumor cells.
Figures


Similar articles
-
GM1 / GD1b / GA1 synthase expression results in the reduced cancer phenotypes with modulation of composition and raft-localization of gangliosides in a melanoma cell line.Cancer Sci. 2010 Sep;101(9):2039-47. doi: 10.1111/j.1349-7006.2010.01613.x. Cancer Sci. 2010. PMID: 20594196 Free PMC article.
-
Ganglioside GD3 enhances adhesion signals and augments malignant properties of melanoma cells by recruiting integrins to glycolipid-enriched microdomains.J Biol Chem. 2010 Aug 27;285(35):27213-27223. doi: 10.1074/jbc.M109.087791. Epub 2010 Jun 25. J Biol Chem. 2010. PMID: 20581115 Free PMC article.
-
Ganglioside GD3 promotes cell growth and invasion through p130Cas and paxillin in malignant melanoma cells.Proc Natl Acad Sci U S A. 2005 Aug 2;102(31):11041-6. doi: 10.1073/pnas.0503658102. Epub 2005 Jul 22. Proc Natl Acad Sci U S A. 2005. PMID: 16040804 Free PMC article.
-
Disialyl gangliosides enhance tumor phenotypes with differential modalities.Glycoconj J. 2012 Dec;29(8-9):579-84. doi: 10.1007/s10719-012-9423-0. Epub 2012 Jul 5. Glycoconj J. 2012. PMID: 22763744 Review.
-
Biosignals modulated by tumor-associated carbohydrate antigens: novel targets for cancer therapy.Ann N Y Acad Sci. 2006 Nov;1086:185-98. doi: 10.1196/annals.1377.017. Ann N Y Acad Sci. 2006. PMID: 17185516 Review.
Cited by
-
Differential roles of gangliosides in malignant properties of melanomas.PLoS One. 2018 Nov 21;13(11):e0206881. doi: 10.1371/journal.pone.0206881. eCollection 2018. PLoS One. 2018. PMID: 30462668 Free PMC article.
-
Transcriptomics and proteomics characterizing the antioxidant mechanisms of semaglutide in diabetic mice with cognitive impairment.Int J Mol Med. 2025 Apr;55(4):56. doi: 10.3892/ijmm.2025.5497. Epub 2025 Jan 31. Int J Mol Med. 2025. PMID: 39886945 Free PMC article.
-
Caveolin-1 is a risk factor for postsurgery metastasis in preclinical melanoma models.Melanoma Res. 2014 Apr;24(2):108-19. doi: 10.1097/CMR.0000000000000046. Melanoma Res. 2014. PMID: 24500501 Free PMC article.
-
Involvement of caveolin-1 in skin diseases.Front Immunol. 2022 Nov 30;13:1035451. doi: 10.3389/fimmu.2022.1035451. eCollection 2022. Front Immunol. 2022. PMID: 36532050 Free PMC article. Review.
-
Rab21 regulates caveolin-1-mediated endocytic trafficking to promote immature neurite pruning.EMBO Rep. 2023 Mar 6;24(3):e54701. doi: 10.15252/embr.202254701. Epub 2023 Jan 23. EMBO Rep. 2023. PMID: 36683567 Free PMC article.
References
-
- Harder T, Simons K. Caveolae, DIGs, and the dynamics of sphingolipid‐cholesterol microdomains. Curr Opin Cell Biol 1997; 9: 534–42. - PubMed
-
- Brown DA, London E. Functions of lipid rafts in biological membranes. Annu Rev Cell Dev Biol 1998; 14: 111–36. - PubMed
-
- Palade GE. Fine structure of blood capillaries. J Appl Phys 1953; 24: 1424.
-
- Parton RG. Caveolae and caveolins. Curr Opin Cell Biol 1996; 8: 542–8. - PubMed
MeSH terms
Substances
LinkOut - more resources
Full Text Sources
Other Literature Sources
Medical
Research Materials
