Comparative Study
. 2007;9(1):R13.
doi: 10.1186/ar2120.

Forced mobilization accelerates pathogenesis: characterization of a preclinical surgical model of osteoarthritis

Affiliations
Comparative Study

Forced mobilization accelerates pathogenesis: characterization of a preclinical surgical model of osteoarthritis

C Thomas G Appleton et al. Arthritis Res Ther. 2007.

Erratum in

  • Arthritis Res Ther. 2008;10(5):407

Abstract

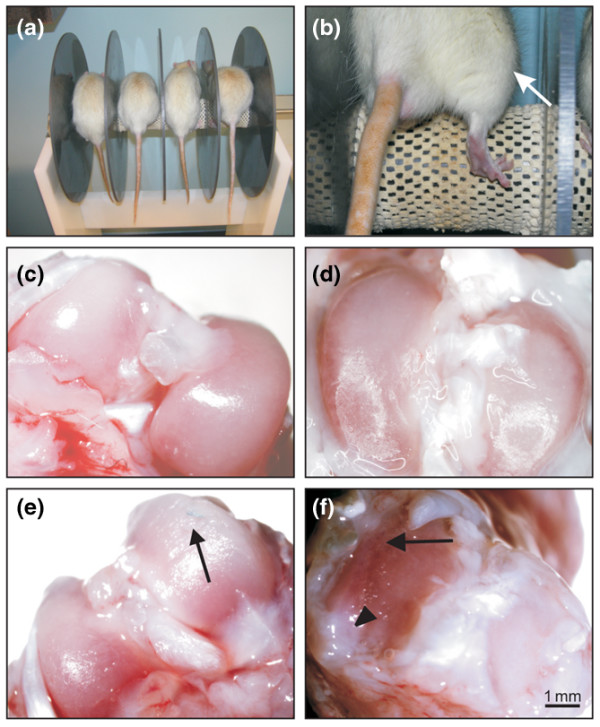
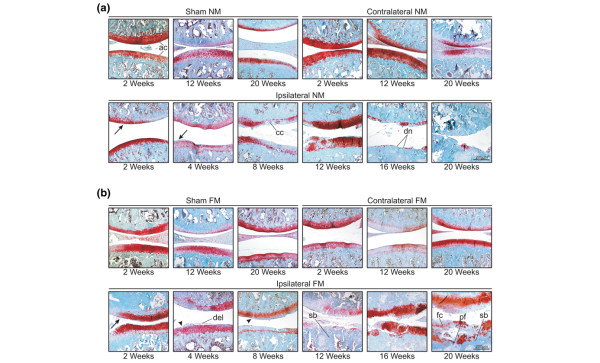
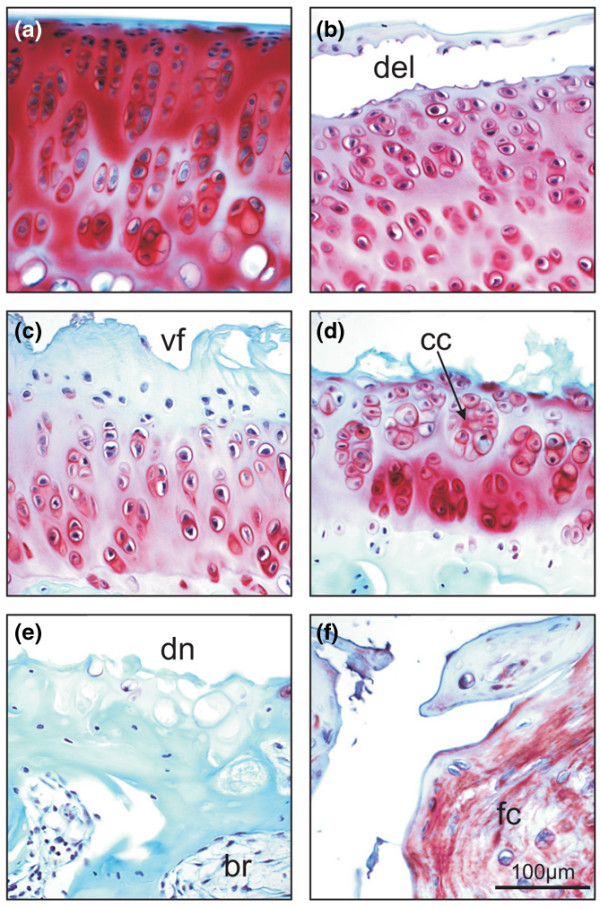
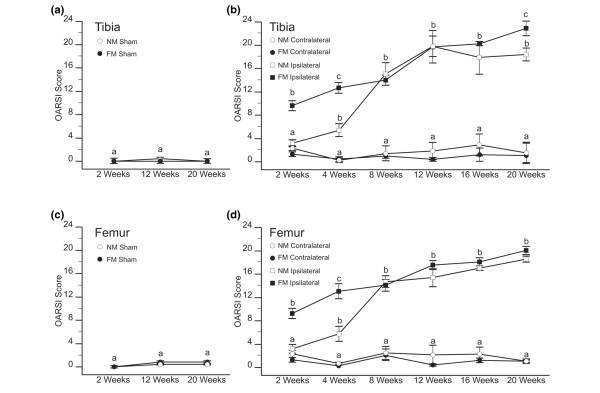
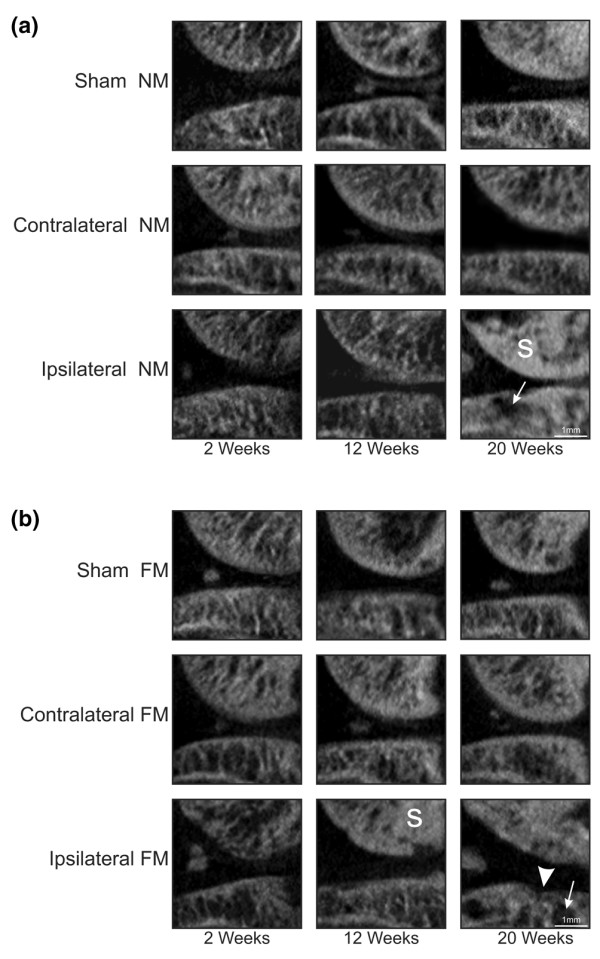
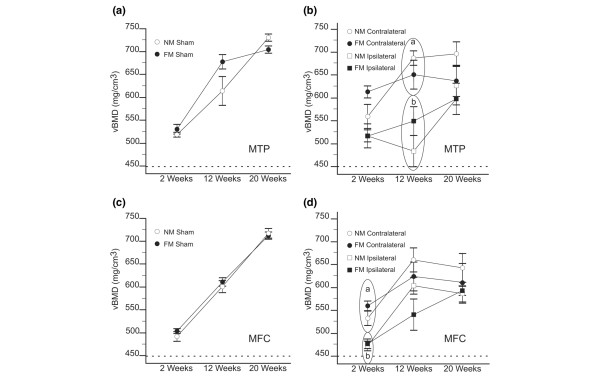
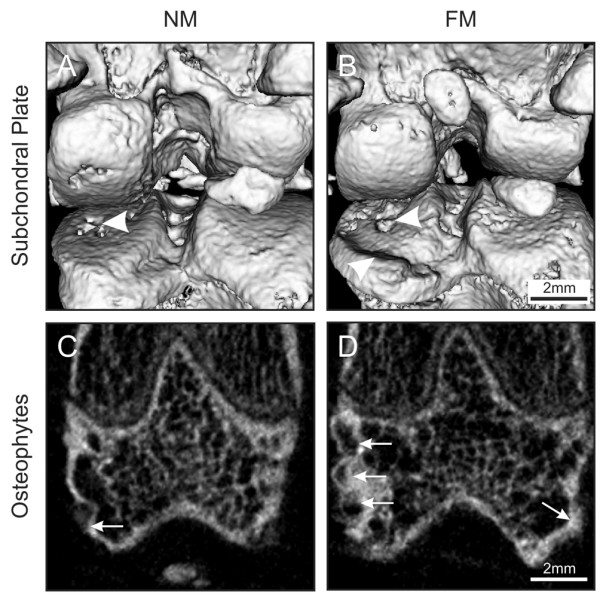
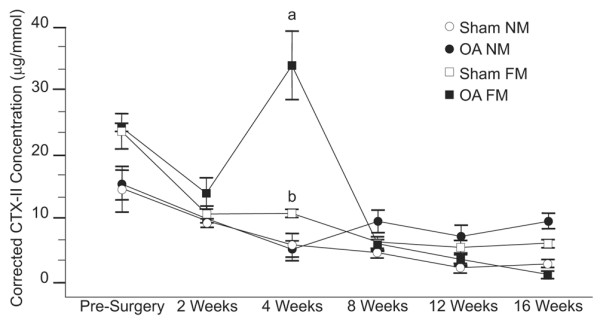
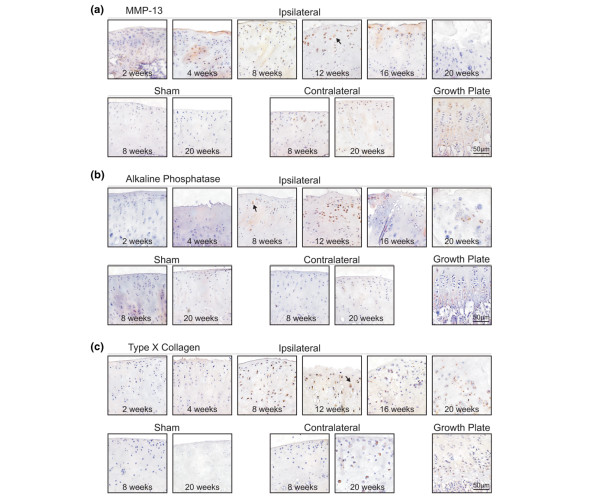
Preclinical osteoarthritis (OA) models are often employed in studies investigating disease-modifying OA drugs (DMOADs). In this study we present a comprehensive, longitudinal evaluation of OA pathogenesis in a rat model of OA, including histologic and biochemical analyses of articular cartilage degradation and assessment of subchondral bone sclerosis. Male Sprague-Dawley rats underwent joint destabilization surgery by anterior cruciate ligament transection and partial medial meniscectomy. The contralateral joint was evaluated as a secondary treatment, and sham surgery was performed in a separate group of animals (controls). Furthermore, the effects of walking on a rotating cylinder (to force mobilization of the joint) on OA pathogenesis were assessed. Destabilization-induced OA was investigated at several time points up to 20 weeks after surgery using Osteoarthritis Research Society International histopathology scores, in vivo micro-computed tomography (CT) volumetric bone mineral density analysis, and biochemical analysis of type II collagen breakdown using the CTX II biomarker. Expression of hypertrophic chondrocyte markers was also assessed in articular cartilage. Cartilage degradation, subchondral changes, and subchondral bone loss were observed as early as 2 weeks after surgery, with considerable correlation to that seen in human OA. We found excellent correlation between histologic changes and micro-CT analysis of underlying bone, which reflected properties of human OA, and identified additional molecular changes that enhance our understanding of OA pathogenesis. Interestingly, forced mobilization exercise accelerated OA progression. Minor OA activity was also observed in the contralateral joint, including proteoglycan loss. Finally, we observed increased chondrocyte hypertrophy during pathogenesis. We conclude that forced mobilization accelerates OA damage in the destabilized joint. This surgical model of OA with forced mobilization is suitable for longitudinal preclinical studies, and it is well adapted for investigation of both early and late stages of OA. The time course of OA progression can be modulated through the use of forced mobilization.


Figures

Figure 1
Figure 1
Forced mobilization apparatus and macroscopic analysis of joint degradation. (a) Following sham (control) or OA surgery, FM animals underwent forced mobilization. Animals walked on a rotating cylinder for 30 min, three times per week. (b) FM forces the maximal extension and flexion of the knee joint (white arrow). To assess macroscopic changes to the articular surface, knee joints were dissected 4 weeks after surgery and photographed. Representative images from sham (c) tibias and (d) femurs, and ipsilateral (e) tibias and (f) femurs are shown. Surface abrasions (black arrow) and fibrotic tissue (arrow head) were observed in ipsilateral surfaces, compared with the smooth, glassy appearance in shams. Scale bar applies to panels c-f. FM, forced mobilization; OA, osteoarthritis.
Figure 2
Figure 2
Histologic analysis over time reveals patterns of articular degradation. Sagittal sections from sham (control), and contralateral and ipsilateral OA treatments, in (a) nonmobilized (NM) and (b) forced mobilization (FM) groups of animals were analyzed over a 20-week time course. Sections were stained with safranin-O (red stain) for articular cartilage matrix proteoglycans, fast green (green stain) for bone and fibrous tissue, and hematoxylin for nuclei (blue). In the upper row of each panel, representative images of sham and contralateral joints are shown at 2, 12, and 20 weeks after surgery. The lower row shows representative sections of ipsilateral joints at all time points assessed. Each image is presented with the femoral joint surface in the upper portion. Examples of morphologically normal articular surface (ac), surface discontinuity (arrow), vertical fissures (arrow head), delamination (del), chondrocyte clusters (cc), denudation (dn), sclerotic bone (sb), fibrocartilage-like tissue (fc), and subchondral plate failure (pf) are indicated. All images are shown at the same magnification, indicated by the scale bars.
Figure 3
Figure 3
High magnification images of sagittal sections of articular cartilage, stained with safranin-O and fast-green, reveal detailed cartilage histology. (a) Healthy-appearing sham cartilage has intact superficial, mid, and deep zones (from top to bottom of image) that stain deeply with safranin-O (red) for glycosaminoglycans. The chondrocytes are arranged in columns. (b) Two week FM ipsilateral cartilage demonstrates delamination (del) of the superficial zone. (c) Four week FM ipsilateral cartilage shows the development of vertical fissures (vf) into the mid-zone, and loss of glycosaminoglycans (pale green stain in mid-zone is red in panel a). (d) Matrix erosion of the superficial and mid-zones is evident by 8 weeks in FM ipsilateral cartilage, as well as the formation of chondrocyte clusters (cc). (e) By 16 weeks, NM ipsilateral cartilage shows almost complete denudation (dn) of the articular cartilage, and evidence of bone repair appears beneath the subchondral plate (br). (f) Fibrocartilage-like tissue (fc) is evident in the articular cartilage of 20-week FM ipsilateral joints, which is indicative of abnormal repair processes. All images are shown at the same magnification, indicated by the scale bar. FM, forced mobilization; NM, nonmobilized.
Figure 4
Figure 4
OARSI histopathology grading and staging scores. OARSI histopathology grading and staging scores were determined in sham (control), and contralateral and ipsilateral treatments of both NM and FM groups of animals over 20 weeks. Tibial joint surfaces from (a) sham and (b) contralateral and ipsilateral treatments were assessed independently of femoral (c) sham and (d) contralateral and ipsilateral joint surfaces. Mean OARSI scores ± standard error are shown. Significantly higher scores were observed in NM contralateral femurs than NM sham femurs at 2 and 12 weeks (statistics not shown). Both ipsilateral surfaces had significantly higher OARSI scores than shams at all time points, except NM ipsilateral surfaces at 2 weeks (statistics not shown). Statistical analysis is done for each individual time point to indicate significantly different means among each of the four contralateral and ipsilateral treatments. Similar means at each time point are indicated by the same letter (a, b, and c), whereas significantly different means at each time point are indicated by different letters (P < 0.05; n = 4). FM, forced mobilization; NM, nonmobilized; OARSI, Osteoarthritis Research Society International.
Figure 5
Figure 5
Micro-CT analysis of subchondral changes over the time course. Knee joints from (a) NM and (b) FM groups of animals were assessed by micro-CT for morphologic changes in subchondral bone in contralateral and ipsilateral joints, compared with sham controls at 2, 12, and 20 weeks. Each sagittal slice at 12 and 20 weeks is shown at the same distance into the medial joint compartment (from the medial margin) as the corresponding histologic section in Figure 2. Subchondral trabecular architecture was maintained in both sham and contralateral joints, regardless of mobilization group. Note the more extensive subchondral spaces in FM compared with NM ipsilateral joints (white arrows). Sclerotic bone (S) appeared earlier in FM (12 weeks) than in NM ipsilateral joints (20 weeks). Collapse of the subchondral plate was evident in 20 week FM joints (arrowhead). All images are shown at the same magnification, indicated by the scale bars. CT, computed tomography; FM, forced mobilization; NM, nonmobilized.
Figure 6
Figure 6
Volumetric bone mineral density analysis over the time course. Micro-CT scans were used to assess vBMD over the 20-week time course. vBMD was compared between NM and FM groups in (a,b) the MTP and (c,d) MFC of sham, and contralateral and ipsilateral treatments. Mean vBMD values ± standard error are shown. No significant effect of FM on vBMD was observed in sham, contralateral, or ipsilateral treatments (compared with NM counterparts). Contralateral vBMD means were not significantly different from sham vBMD means at any time point (statistics not indicated). Statistical analysis is done for each individual time point to indicate significantly different means among the four contralateral and ipsilateral treatments. Only at the time points where significantly different means were identified are similar means encircled, whereas significantly different means are indicated by different circles labeled a or b (P < 0.05; n = 4). CT, computed tomography; FM, forced mobilization; MFC, medial femoral compartment; MTP, medial tibial plateau; NM, nonmobilized; vBMD, volumetric bone mineral density.
Figure 7
Figure 7
Reconstruction of micro-CT volumes reveals subchondral plate degeneration and osteophytes. Qualitative assessment of (a,b) subchondral plate integrity and (c,d) femoral osteophyte formation is shown. Reconstruction of the three-dimensional micro-CT volumes and surface rendering was used to assess the integrity of the subchondral plate in (a) NM and (b) FM ipsilateral joints at 20 weeks. Dorsal views of the reconstructed knee joints are shown. In panel a the tibial subchondral plate of NM joints exhibited minor plate breakdown (arrowhead) in the medial plateau, whereas in panel b FM plates were completely compromised by erosion and pitting (arrowheads). Coronal sections of (c) NM and (d) FM ipsilateral joints at 20 weeks reveal the presence of osteophytes (arrows). FM joints exhibit many well developed osteophytes on both medial (left) and lateral (right) joint margins, whereas NM joints show only slight medial osteophyte development (containing little mineral content). The magnification of each image is the same, indicated by the scale bars. CT, computed tomography; FM, forced mobilization; NM, nonmobilized.
Figure 8
Figure 8
Biochemical analysis of CTX II levels as an indicator of cartilage turnover. Quantitative biochemical analysis of cartilage breakdown (type II collagen fragments) was performed on urine samples using the CTX II Pre-Clinical CartiLaps® enzyme-linked immunosorbent assay. Ten animals underwent sham surgery (control) and 10 underwent OA surgery. Five animals from each group were randomly selected for FM studies, and the remaining five for NM studies. Spot urine was collected presurgically and at 2, 4, 8, 12, and 16 weeks after surgery. Samples were assayed for CTX II concentration and normalized to urine creatinine concentration. Mean CTX II concentrations corrected to creatinine ± standard error are shown. Statistical analysis was performed to test for significant differences between groups, at each time point. Only significantly different means are indicated by 'a' and 'b' (P < 0.05; n = 5). FM, forced mobilization; NM, nonmobilized; OA, osteoarthritis.
Figure 9
Figure 9
Immunostaining for markers of chondrocyte hypertrophy. Immunostaining for markers of chondrocyte hypertrophy was performed in articular cartilage sections from FM animals. Sections were probed with (a) anti-MMP-13, (b) anti-alkaline phosphatase, or (c) anti-type X collagen primary antibodies, followed by secondary antibodies conjugated to horseradish peroxidase. Colourimetric detection of each protein (brown precipitate) was carried out for equal time periods for all sections probed with the same primary antibody. Nuclei are counterstained with hematoxylin (blue). In the top row of each panel, representative sections from all time points following surgery in ipsilateral knee joints are shown. In the bottom row of each panel, representative sections from sham and contralateral knee joints at 8 and 20 weeks after surgery are shown. As a positive control, sections containing the growth plate are shown in each panel to demonstrate the expression of each protein in hypertrophic chondrocytes. Articular chondrocytes with a hypertrophic-like morphology are also indicated (arrows). Experiments for each protein were carried out on sections from at least three different animals with reproducible results. All images are shown at the same magnification, as indicated by the scale bars. FM, forced mobilization; MMP, matrix metalloproteinase.

References

    1. Altman R, Asch E, Bloch D, Bole G, Borenstein D, Brandt K, Christy W, Cooke TD, Greenwald R, Hochberg M, et al. Development of criteria for the classification and reporting of osteoarthritis. Classification of osteoarthritis of the knee. Diagnostic and Therapeutic Criteria Committee of the American Rheumatism Association. Arthritis Rheum. 1986;29:1039–1049. doi: 10.1002/art.1780290816. - DOI - PubMed
    1. Felson DT, Neogi T. Osteoarthritis: is it a disease of cartilage or of bone? Arthritis Rheum. 2004;50:341–344. doi: 10.1002/art.20051. - DOI - PubMed
    1. Mandelbaum B, Waddell D. Etiology and pathophysiology of osteoarthritis. Orthopedics. 2005;28:s207–s214. - PubMed
    1. Blumenkrantz G, Lindsey CT, Dunn TC, Jin H, Ries MD, Link TM, Steinbach LS, Majumdar S. A pilot, two-year longitudinal study of the interrelationship between trabecular bone and articular cartilage in the osteoarthritic knee. Osteoarthritis Cartilage. 2004;12:997–1005. doi: 10.1016/j.joca.2004.09.001. - DOI - PubMed
    1. Petersson IF, Jacobsson LT. Osteoarthritis of the peripheral joints. Best Pract Res Clin Rheumatol. 2002;16:741–760. doi: 10.1053/berh.2002.0266. - DOI - PubMed

Publication types

Grants and funding