. 2007 Mar 30;282(13):10057-10067.
doi: 10.1074/jbc.M700746200. Epub 2007 Feb 6.

The spatial distribution of inositol 1,4,5-trisphosphate receptor isoforms shapes Ca2+ waves

Affiliations

The spatial distribution of inositol 1,4,5-trisphosphate receptor isoforms shapes Ca2+ waves

Erick Hernandez et al. J Biol Chem. .

Abstract

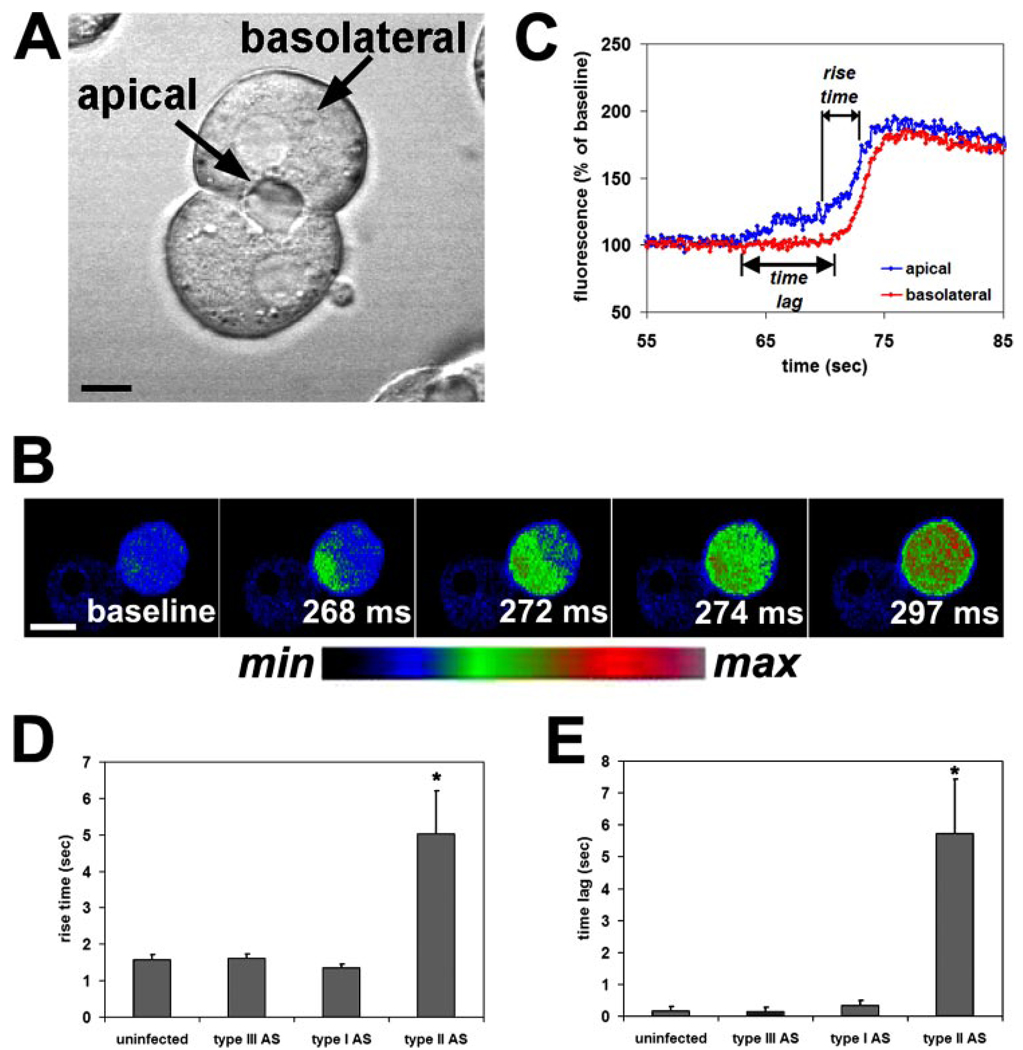
Cytosolic Ca(2+) is a versatile second messenger that can regulate multiple cellular processes simultaneously. This is accomplished in part through Ca(2+) waves and other spatial patterns of Ca(2+) signals. To investigate the mechanism responsible for the formation of Ca(2+) waves, we examined the role of inositol 1,4,5-trisphosphate receptor (InsP3R) isoforms in Ca(2+) wave formation. Ca(2+) signals were examined in hepatocytes, which express the type I and II InsP3R in a polarized fashion, and in AR4-2J cells, a nonpolarized cell line that expresses type I and II InsP3R in a ratio similar to what is found in hepatocytes but homogeneously throughout the cell. Expression of type I or II InsP3R was selectively suppressed by isoform-specific DNA antisense in an adenoviral delivery system, which was delivered to AR4-2J cells in culture and to hepatocytes in vivo. Loss of either isoform inhibited Ca(2+) signals to a similar extent in AR4-2J cells. In contrast, loss of the basolateral type I InsP3R decreased the sensitivity of hepatocytes to vasopressin but had little effect on the initiation or spread of Ca(2+) waves across hepatocytes. Loss of the apical type II isoform caused an even greater decrease in the sensitivity of hepatocytes to vasopressin and resulted in Ca(2+) waves that were much slower and delayed in onset. These findings provide evidence that the apical concentration of type II InsP3Rs is essential for the formation of Ca(2+) waves in hepatocytes. The subcellular distribution of InsP3R isoforms may critically determine the repertoire of spatial patterns of Ca(2+) signals.


Figures

FIGURE 1
FIGURE 1. Sequence alignments for InsP3 receptor regions used for antisense constructs
A, sense sequence used for antisense for the type I InsP3R is shown in alignment with the same base pair positions for the type II and the type III isoforms of the InsP3R. Asterisk indicates nucleotides that are found in identical positions in all three sequences. The sequences for the type I, II, and III InsP3Rs are from rat brain, liver, and endocrine pancreas, respectively. B, sense sequence used for the type II antisense construct is shown in alignment with the corresponding base pair positions of the type I and the type III isoforms of the InsP3R. C, alignment of the sense sequence for the type III antisense construct with the corresponding sequences from the type I and type II isoforms of the InsP3R. In each case, there is minimal homology with the sequence used for the antisense construct.
FIGURE 2
FIGURE 2. The type I and type II isoforms of the InsP3R are distributed homogeneously in the cytosol of AR4-2J cells
Images were obtained by confocal immunofluorescence. Cells were double-labeled with antibodies specific for either the type I or the type II isoform of the InsP3R (green) and with TO-PRO-3 to stain the cell nucleus. A, labeling of type I InsP3R (scale bar, 20 µm). B, nuclear staining with TO-PRO-3. C, merged image shows that this isoform of the receptor is distributed throughout the cytosol and is found within the nucleus as well. D, labeling of the type II isoform of the InsP3R (scale bar, 20 µm). E, nuclear staining with TO-PRO-3. F, merged image shows that this isoform also is distributed throughout the cytosol.
FIGURE 3
FIGURE 3. Efficacy and specificity of adenoviral antisense constructs for each InsP3R isoform
A, effect of type I antisense (AS) on expression of the type I InsP3R in AR4-2J cells. The adenoviral construct markedly decreases expression of the type I isoform both 24 and 48 h after infection (left and right lanes, respectively), relative to uninfected control cells (ctrl). In contrast, expression of this isoform was not decreased 24 or 48 h after infection with the adenoviral DsRed construct (left and right lanes, respectively). B, expression of the type II isoform is not decreased 24 or 48 h after infection with the antisense construct for the type I InsP3R (left and right lanes, respectively), relative to uninfected control cells. C, effect of type II antisense on expression of the type II InsP3R in AR4-2J cells. The adenoviral construct markedly decreases expression of the type II isoform both 24 and 48 h after infection (left and right lanes, respectively), relative to uninfected control cells. In contrast, expression of this isoform was not decreased 24 or 48 h after infection with the adenoviral DsRed construct. D, expression of the type I isoform is not decreased 24 or 48 h after infection with the antisense construct for the type II InsP3R (left and right lanes, respectively), relative to uninfected control cells. E, effect of type III antisense on expression of the type III InsP3R in RIN cells. The adenoviral construct markedly decreases expression of the type III isoform 48 h (right) but not 24 h (left) after infection, relative to uninfected control cells. Each immunoblot was performed using 25 µg of protein/lane, and cells were infected with each adenovirus at a concentration of 5 ± 10 pfu/ml (m.o.i. = 40).
FIGURE 4
FIGURE 4. Type I and II InsP3R contribute similarly to Ca2+ signaling in AR4-2J cells
Cells were loaded with Fluo-4 and stimulated with ACh (10 µm), and the resulting cytosolic Ca2+ signal was monitored by confocal microscopy. A, tracings from representative single cells that were not transfected (blue) or transfected with antisense for the type I (red) or type II (green) InsP3R. B, summary of results. The amplitude of the ACh-induced Ca2+ signal was not decreased relative to uninfected controls in cells infected with adenoviral DsRed, but it was decreased significantly and to a similar extent in cells infected with either adenoviral antisense (*, p < 10−10 for both antisense groups; n = 20–22 cells for each of the four groups). Values shown are mean ± S.D. C, amplitude of the ACh-induced Ca2+ signal for a range of ACh concentrations. Cells lacking either the type I or type II InsP3R have a decreased response to ACh relative to nontransfected controls, but only for high ACh concentrations (*, p < 0.05). D, percentage of cells in which ACh increases cytosolic Ca2+ in AR4-2J cells. Cells lacking either the type I or type II InsP3R have decreased sensitivity to low concentrations of ACh relative to nontransfected controls (*, p < 0.05). E, time lag between exposure to ACh and onset of Ca2+ signal (measured only in those cells in which a Ca2+ increase occurs). A significant delay is detected upon stimulation with a range of concentrations of ACh in AR4-2J cells lacking either type I or type II InsP3Rs (*, p < 0.05). C–E, an average of 130 cells was examined in each experimental group at each concentration of ACh. Values are mean ± S.E.
FIGURE 5
FIGURE 5. Adenoviral antisense constructs selectively reduce expression of InsP3R isoforms in hepatocytes in vivo
The adenoviral constructs were injected in the portal vein as described under “Experimental Procedures,” and after 48 h the liver was excised; hepatocytes were isolated, and Western blotting was performed. A, portal injection of adenovirus for type I InsP3R antisense (ASI) reduces expression of type I InsP3R in hepatocytes relative to control (CT), whereas injection of adenovirus for type II InsP3R antisense (ASII) does not affect type I InsP3R expression. B, portal injection of adenovirus for type II InsP3R antisense reduces expression of type II InsP3R in hepatocytes, whereas injection of adenovirus for type I InsP3R antisense does not. In each case, densitometry measurements were normalized by densitometry values obtained for the loading control, actin. Results are representative of those observed in at least three separate experiments. IB, immunoblot; cntl, control.
FIGURE 6
FIGURE 6. Adenoviral antisense for the type I InsP3R specifically inhibits expression of the type I isoform in hepatocytes in vivo
The adenoviral construct was injected in the portal vein as described under “Experimental Procedures,” and after 48 h the liver was excised, sectioned, stained with isoform-specific InsP3R antibodies (green), counterstained with the actin stain rhodamine phalloidin (red) to outline individual hepatocytes, and examined by confocal microscopy. A–C, distribution of type I InsP3R in control (noninfected) rat liver. The type I InsP3R is distributed throughout the cytosol of hepatocytes under normal conditions, as has been described previously (8). Scale bar, 20 µm. D–F, labeling for the type I InsP3R is nearly absent from hepatocytes 48 h after portal injection of adenoviral antisense. G–I, distribution of type II InsP3R in hepatocytes 48 h after injection of the adenoviral construct. The type II InsP3R is concentrated in the canalicular (apical) region, identified by the yellow (double) labeling in the merged image in I. This is the same as the distribution of this isoform in hepatocytes under normal conditions (Fig. 7, A–C) (8). Therefore, the distribution of the type II isoform is not affected by the adenoviral antisense construct for the type I InsP3R.
FIGURE 7
FIGURE 7. Adenoviral antisense for the type II InsP3R specifically inhibits expression of the type II isoform in hepatocytes in vivo
The adenoviral construct was injected in the portal vein as described under “Experimental Procedures,” and after 48 h the liver was excised, sectioned, stained with isoform-specific InsP3R antibodies (green), counterstained with the actin stain rhodamine phalloidin (red) to outline individual hepatocytes, and examined by confocal microscopy. A–C, distribution of type II InsP3R in control (noninfected) rat liver. The type II InsP3R is concentrated in the canalicular region of hepatocytes under normal conditions, as has been described previously (8). Scale bar, 20 µm. D–F, labeling for the type II InsP3R is nearly absent from hepatocytes 48 h after portal injection of adenoviral antisense. G–I, distribution of type I InsP3R in hepatocytes 48 h after injection of the adenoviral construct. The type I InsP3R is distributed throughout the cytosol of hepatocytes, similar to what is observed under normal conditions (Fig. 6, A–C). Therefore, the distribution of the type I isoform is not affected by the adenoviral antisense construct for the type II InsP3R.
FIGURE 8
FIGURE 8. Adenoviral antisense for the type III InsP3R does not inhibit expression of the type I or type II isoform in hepatocytes in vivo
The adenoviral construct was injected in the portal vein as described under “Experimental Procedures,” and after 48 h the liver was excised, sectioned, stained with isoform-specific InsP3R antibodies (green), counterstained with the actin stain rhodamine phalloidin (red) to outline individual hepatocytes, and examined by confocal microscopy. A–C, distribution of type I InsP3R in hepatocytes 48 h after injection of the adenoviral construct. The type I InsP3R is distributed throughout the cytosol of hepatocytes, similar to what is observed under normal conditions (Fig. 6, A–C). D–F, distribution of type II InsP3R in hepatocytes 48 h after injection of the adenoviral construct. The type II InsP3R is concentrated in the canalicular region, identified by the yellow (double) labeling in the merged image in F. This is the same as the distribution of this isoform in hepatocytes under normal conditions (Fig. 7, A–C). Therefore, neither the distribution of the type I nor the type II isoform is affected by the adenoviral antisense construct for the type III InsP3R. Scale bars, 20 µm.
FIGURE 9
FIGURE 9. InsP3R isoforms affect vasopressin-induced Ca2+ signals in hepatocytes in a concentration-dependent fashion
Hepatocytes were isolated 48 h after portal injection of adenoviral antisense constructs, and then vasopressin-induced Ca2+ signals were examined by confocal microscopy. A, percentage of cells in which vasopressin increases cytosolic Ca2+ in hepatocytes. Cells lacking the type I InsP3R have decreased sensitivity to low concentrations of vasopressin, whereas cells lacking the type II isoform have decreased sensitivity to vasopressin at all concentrations (*, p < 0.005 by repeated measures ANOVA). B, time lag between exposure to vasopressin and onset of Ca2+ signal (measured only in those cells in which a Ca2+ increase occurs). A significant delay is detected upon stimulation with a range of concentrations of vasopressin in hepatocytes lacking either type I or type II InsP3Rs (*, p < 0.05). A minimum of 30–40 cells was examined in each experimental group at each concentration of vasopressin. Values are mean ± S.D.
FIGURE 10
FIGURE 10. Loss of the type II InsP3R selectively impairs Ca2+ waves in hepatocytes
Hepatocyte couples and triplets were stimulated with vasopressin (10 nm), and Ca2+ wave kinetics were analyzed. A, transmission image of an isolated rat hepatocyte couplet illustrates the apical and basolateral region of the cells. Scale bar, 10 µm. B, serial confocal images of a couplet loaded with the Ca2+ dye Fluo-4 and stimulated with vasopressin (10 nm) illustrates a Ca2+ wave spreading from the apical to the basolateral pole of one of the cells. Images are pseudocolored according to the color scale below. Scale bar, 20 µm. C, graphical representation of the apical and basolateral components of a Ca2+ wave in a single hepatocyte. The tracing illustrates measurement of the rise time (time required for the apical Ca2+ signal to increase from 20 to 80% of its peak) and the time lag (time required for the signal to move from the apical to the basolateral region). D, rise time is significantly delayed in cells from animals treated with the adenoviral antisense (AS) for the type II InsP3R (*, p < 0.005) but not in cells from animals treated with the type I or III antisense. E, time lag also is significantly delayed in cells from animals treated with the adenoviral antisense (AS) for the type II InsP3R (*, p < 0.005) but not in cells from animals treated with the type I or III antisense. Values are mean ± S.E.

Similar articles

Cited by

References

    1. Berridge MJ, Lipp P, Bootman MD. Nat. Rev. Mol. Cell Biol. 2000;1:11–21. - PubMed
    1. Leite MF, Nathanson MH. In: The Liver: Biology and Pathobiology. Arias IM, editor. Philadelphia: Lippincott, Williams, and Wilkins; 2001. pp. 537–554.
    1. Gilland E, Miller AL, Karplus E, Baker R, Webb SE. Proc. Natl. Acad. Sci. U. S. A. 1999;96:157–161. - PMC - PubMed
    1. Kasai H, Augustine GJ. Nature. 1990;348:735–738. - PubMed
    1. Ito K, Miyashita Y, Kasai H. EMBO J. 1997;16:242–251. - PMC - PubMed

Publication types

MeSH terms

LinkOut - more resources