. 2007;35(5):1465-77.
doi: 10.1093/nar/gkm008. Epub 2007 Feb 6.

DISPLAR: an accurate method for predicting DNA-binding sites on protein surfaces

Affiliations

DISPLAR: an accurate method for predicting DNA-binding sites on protein surfaces

Harianto Tjong et al. Nucleic Acids Res. 2007.

Abstract

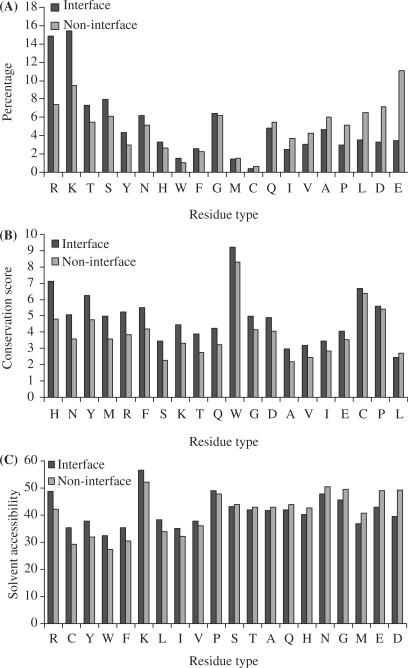
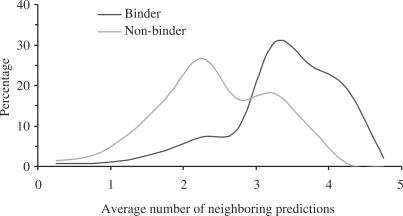
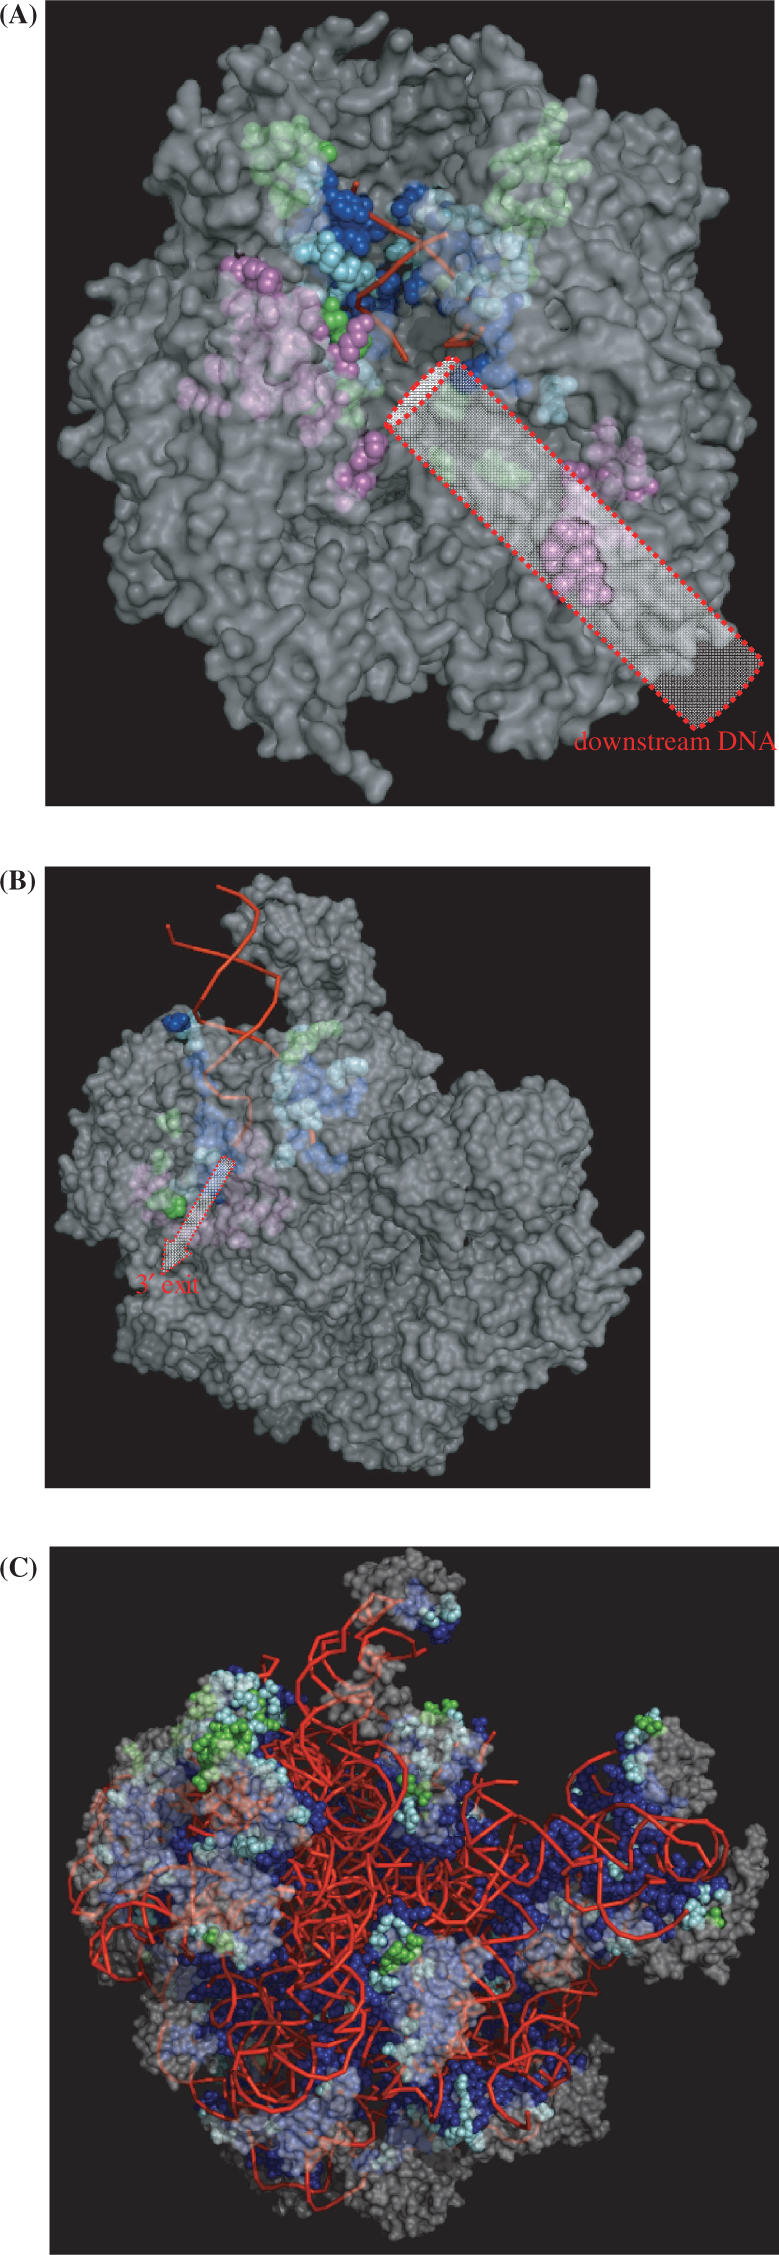
Structural and physical properties of DNA provide important constraints on the binding sites formed on surfaces of DNA-targeting proteins. Characteristics of such binding sites may form the basis for predicting DNA-binding sites from the structures of proteins alone. Such an approach has been successfully developed for predicting protein-protein interface. Here this approach is adapted for predicting DNA-binding sites. We used a representative set of 264 protein-DNA complexes from the Protein Data Bank to analyze characteristics and to train and test a neural network predictor of DNA-binding sites. The input to the predictor consisted of PSI-blast sequence profiles and solvent accessibilities of each surface residue and 14 of its closest neighboring residues. Predicted DNA-contacting residues cover 60% of actual DNA-contacting residues and have an accuracy of 76%. This method significantly outperforms previous attempts of DNA-binding site predictions. Its application to the prion protein yielded a DNA-binding site that is consistent with recent NMR chemical shift perturbation data, suggesting that it can complement experimental techniques in characterizing protein-DNA interfaces.


Figures

Figure 1.
Figure 1.
Comparison between DNA-contacting surface residues and non-contacting surface residues. A Percentages of the 20 types of amino acids in the interface and non-interface groups. The abscissa is in descending order of the difference between the two groups. B Conservation scores in the interface and non-interface groups for the 20 types of amino acids, in descending order of the difference. C Solvent accessibilities in the interface and non-interface groups for the 20 types of amino acids, in descending order of the difference. Results were obtained from analysis of 56 093 surface residues in the data set of 264 representative DNA-binding proteins.
Figure 2.
Figure 2.
Predicted DNA-contacting residues shown on the protein–DNA complexes. Predictions are shown in three different colors: actual DNA-contacting residues are in blue, their nearest neighbors are in cyan and incorrect predictions are in green. The rest of the protein surface is in yellow; the bound DNA is shown as red lines. (A) 1brn. (B) 1gd2. (C) 1s40. (D) 1u1q. In the last panel, there are two protein chains related by a 2-fold rotation, one on the left and one on the right. Within the left chain, the C and N-terminal RNA recognition motifs are at the top and bottom, respectively. The pictures here and those in Figures 4 and 6 are generated with PyMOL (http://www.pymol.org).
Figure 3.
Figure 3.
Two types of gross conformational changes upon DNA binding. (A) Global distortion from the unbound (PDB 2alc; in yellow) to the bound (PDB 1f5e; in green) structures. (B) Domain rearrangement from the unbound (PDB 1ikn) to the bound (PDB 1lei) structures. The N- and C-terminal domains of chain A in 1ikn are shown in orange and yellow; the C-terminal domain of chain C in 1ikn are shown in magenta. The N- and C-terminal domains of chain A in 1lei are shown in dark and light green; the N- and C-terminal domains of chain B in 1lei are shown in dark and light blue. The light green and dark blue domains in 1lei are rotated by ∼180° from the corresponding yellow and magenta domains in 1ikn when the dark green domain of 1lei and the orange domain of 1ikn are superimposed. The counterpart of the light blue domain of 1lei is missing in 1ikn. Bound DNA are shown as red lines in both panels. The pictures are generated with VMD (http://www.ks.uiuc.edu/Research/vmd/).
Figure 4.
Figure 4.
Comparison of prion protein (PDB 1b10) residues (A) implicated by NMR chemical shift perturbation and (B) predicted by DISPLAR for DNA binding. Putative DNA-contacting residues are shown in red or blue.
Figure 5.
Figure 5.
The distributions of average numbers of neighboring predictions for protein binding and non-binding proteins.
Figure 6.
Figure 6.
Predicted nucleic acid-contacting residues shown on the protein–nucleic acid complexes. Predicted residues are shown as spheres, with blue indicating actual DNA-contacting residues, cyan their nearest neighbors, and green incorrect predictions. The rest of the protein surface is in semi-transparent gray; the backbone trace of bound DNA is displayed by red lines. (A) RNA polymerase II elongation complex (PDB 1i6h). A cylinder is drawn to indicate downstream DNA; predicted residues in its binding site are shown in magenta. (B) RecBCD–DNA complex (PDB 1w36). An arrow is drawn to indicate the 3′ exit; predicted residues along the exit are shown in magenta. (C) Ribosome (PDB 1vqp). In (A) and (B) residues shown in magenta were not used in reporting prediction accuracy since at these sites DNA structures were not resolved.

References

    1. Zhou H-X, Shan Y. Prediction of protein interaction sites from sequence profile and residue neighbor list. Proteins. 2001;44:336–343. - PubMed
    1. Chen H, Zhou H-X. Prediction of interface residues in protein-protein complexes by a consensus neural network method: test against NMR data. Proteins. 2005;61:21–35. - PubMed
    1. Luscombe NM, Laskowski RA, Thornton JM. Amino acid-base interactions: a three-dimensional analysis of protein–DNA interactions at an atomic level. Nucl. Acids Res. 2001;29:2860–2874. - PMC - PubMed
    1. Stawiski EW, Gregoret LM, Mandel-Gutfreund Y. Annotating nucleic acid-binding function based on protein structure. J. Mol. Biol. 2003;326:1065–1079. - PubMed
    1. Jones S, Shanahan HP, Berman HM, Thornton JM. Using electrostatic potentials to predict DNA-binding sites on DNA-binding proteins. Nucl. Acids Res. 2003;31:7189–7198. - PMC - PubMed

Publication types