. 2007 May 15;109(10):4494-502.
doi: 10.1182/blood-2006-04-016154. Epub 2007 Feb 6.

BMP4, SCF, and hypoxia cooperatively regulate the expansion of murine stress erythroid progenitors

Affiliations

BMP4, SCF, and hypoxia cooperatively regulate the expansion of murine stress erythroid progenitors

John M Perry et al. Blood. .

Abstract

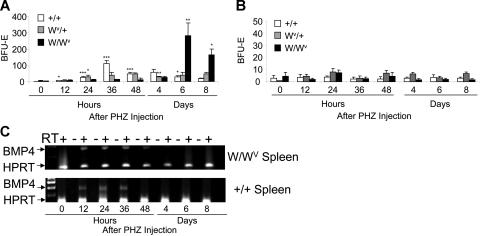
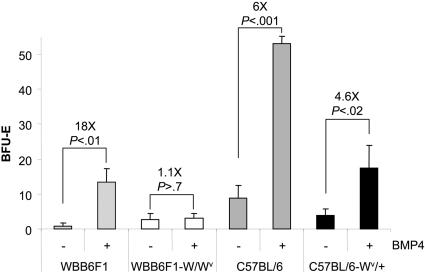
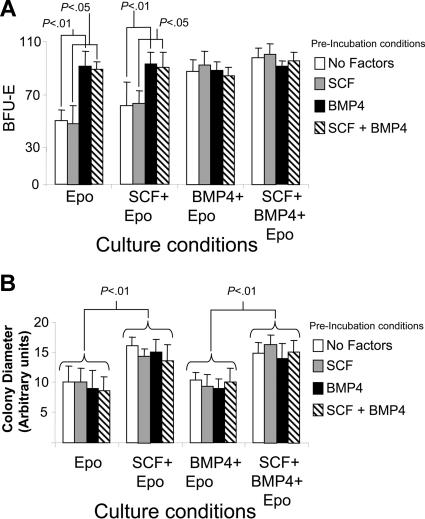
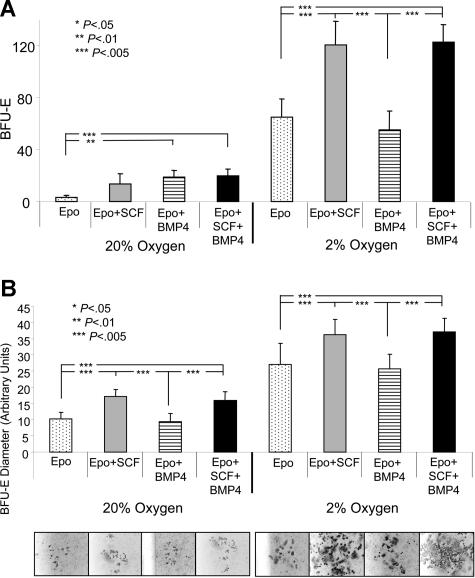
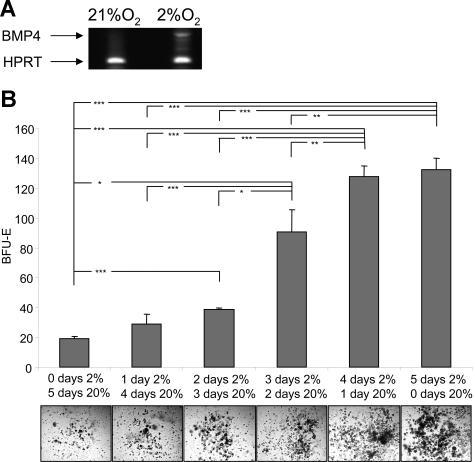
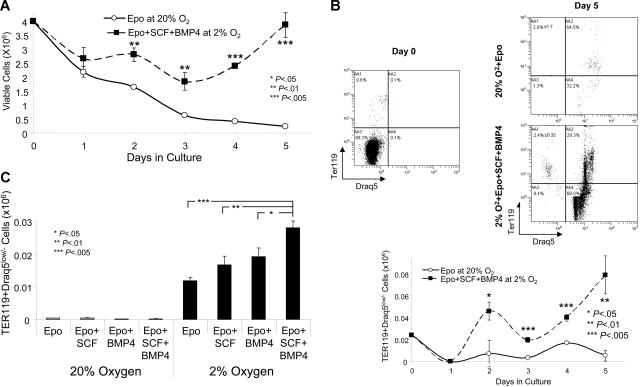
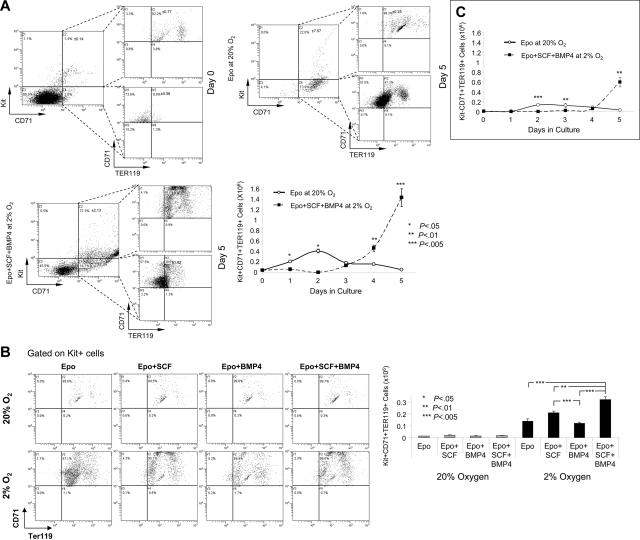
The erythroid response to acute anemia relies on the rapid expansion in the spleen of a specialized population of erythroid progenitors termed stress BFU-E. This expansion requires BMP4/Madh5-dependent signaling in vivo; however, in vitro, BMP4 alone cannot recapitulate the expansion of stress BFU-E observed in vivo, which suggests that other signals are required. In this report we show that mutation of the Kit receptor results in a severe defect in the expansion of stress BFU-E, indicating a role for the Kit/SCF signaling pathway in stress erythropoiesis. In vitro analysis showed that BMP4 and SCF are necessary for the expansion of stress BFU-E, but only when spleen cells were cultured in BMP4 + SCF at low-oxygen concentrations did we recapitulate the expansion of stress BFU-E observed in vivo. Culturing spleen cells in BMP4, SCF under hypoxic conditions resulted in the preferential expansion of erythroid progenitors characterized by the expression of Kit, CD71, and TER119. This expression pattern is also seen in stress erythroid progenitors isolated from patients with sickle cell anemia and patients with beta-thalassemia. Taken together these data demonstrate that SCF and hypoxia synergize with BMP4 to promote the expansion and differentiation of stress BFU-E during the recovery from acute anemia.


Figures

Figure 1
Figure 1
W/Wv mice exhibit a delayed expansion of stress BFU-Es in the spleen during the recovery from acute anemia. W/Wv, Wv/+, and control mice were treated with phenylhydrazine to induce acute anemia. (A) Spleen cells and (B) bone marrow cells were plated in methylcellulose media containing Epo (3 U/mL) at the indicated times after PHZ treatment, and the number of stress BFU-Es were measured. (A-B) *P < .05, **P < .01, ***P < .005 when one value was compared with the previous time point. Each time point represents the average of 3 mice each done in triplicate. (C) Reverse transcription–polymerase chain reaction (RT-PCR) analysis of BMP4 expression in the spleen of W/Wv and control mice. Error bars indicate standard deviation (SD).
Figure 2
Figure 2
WBB6F1-W/Wv spleen contains few BMP4R cells. Spleen cells from WBB6F1 control, WBB6F1-W/Wv, C57BL/6 control, and C57BL/6-Wv/+ mice were plated in media containing Epo (3 U/mL) or Epo + BMP4 (15 ng/mL). The values indicated are the average of 2 mice each done in triplicate. The fold increase in stress BFU-Es when BMP4 was included in the media was calculated by dividing the number of stress BFU-E colonies observed in Epo + BMP4 by the number of stress BFU-E colonies observed in media containing only Epo. Error bars indicate SD.
Figure 3
Figure 3
Analysis of the role of SCF and BMP4 in increasing the number and size of stress BFU-E colonies in vitro. Spleen cells from C57BL/6 mice were preincubated in media containing no factors, SCF, BMP4, or BMP4 + SCF for 24 hours as indicated. The cells were then washed and plated in methylcellulose media containing the indicated factors for 5 days. (A) Stress BFU-Es were scored, and (B) stress BFU-E colony diameter was measured. The results presented are the average of 2 independent experiments. Error bars indicate SD.
Figure 4
Figure 4
Hypoxia acts in concert with BMP4 and SCF to induce stress BFU-E expansion in vitro. Spleen cells were plated in methylcellulose media containing the indicated factors and grown at 20% or 2% O2. (A) Stress BFU-Es were scored after 5 days of culture. (B) The average diameter of stress BFU-E colonies was determined. Representative colonies are presented below each condition. The results presented are the average of 2 independent experiments.
Figure 5
Figure 5
Hypoxia induces BMP4 expression and alters the response of stress BFU-Es to BMP4 and SCF. (A) Spleen cells were grown for 24 hours at 20% or 2% O2. Expression of BMP4 mRNA was measured by RT-PCR. (B) Spleen cells were plated in methylcellulose media containing Epo and grown for the indicated times in 20% or 2% O2. *P < .05, **P < .01, ***P < .005 for the indicated comparisons.
Figure 6
Figure 6
BMP4 + SCF + hypoxia promotes the terminal differentiation (TER119+Draq5low/−) spleen stress erythroid progenitors in vitro. Spleen cells were cultured in Epo at 20% O2 or Epo + BMP4 + SCF at 2% O2 (A-B) or in the indicated conditions (C) in liquid culture. (A). Viable cells were determined by trypan blue staining on the indicated days of culture. (B). Cells were stained on days 0 and 5 of culture for TER119 and Draq5. The top panel shows representative flow diagrams and the bottom panel shows the total number of Ter119+Draq5low/− cells in the culture at days 0 to 5. (C). Cells were grown in the indicated conditions, and the total number of Ter119+Draq5low/− cells in the culture is shown at day 4. The flow diagrams for this graph are presented in Figure S2. These data are representative of 3 independent experiments.
Figure 7
Figure 7
BMP4, SCF, and hypoxia preferentially expand Kit+CD71+TER119+ stress erythroid progenitors. (A) Flow cytometry analysis of Kit, CD71, and TER119 expression of spleen cells cultured in media containing Epo at 20% O2 or Epo + BMP4 + SCF at 2% O2. Top panel shows expression at day 0 and day 5 of culture. Bottom panel shows the total number of Kit+CD71+TER119+ cells on each day of the 5-day culture period. The flow diagrams for this analysis are presented in Figure S3. (B). The top panel shows the flow diagrams gated on Kit+ cells showing the expression of CD71 and Ter119. Bottom panel shows the total number of Kit+CD71+TER119+ cells at day 4 of culture in the indicated conditions. (C) Total number of KitCD71+TER119+ cells generated on each day when spleen cells were cultured in Epo at 20% O2 or Epo + BMP4 + SCF at 2% O2 for 5 days. The flow diagrams for these data are presented in Figure S4B. These data are representative of 3 independent experiments.

Similar articles

Cited by

References

    1. Lenox L, Perry J, Paulson R. BMP4 and Madh5 regulate the erythroid response to acute anemia. Blood. 2005;105:2741–2748. - PubMed
    1. Bernstein A, Forrester L, Reith AD, Dubreuil P, Rottapel R. The murine W/c-kit and Steel loci and the control of hematopoiesis. Semin Hematol. 1991;28:138–142. - PubMed
    1. Russell ES. Hereditary anemias of the mouse: a review for geneticists. Adv Genet. 1979;20:357–459. - PubMed
    1. Ashman LK. The biology of stem cell factor and its receptor C-kit. Int J Biochem Cell Biol. 1999;31:1037–1051. - PubMed
    1. Huang E, Nocka K, Beier DR, et al. The hematopoietic growth factor KL is encoded by the Sl locus and is the ligand of the c-kit receptor, the gene product of the W locus. Cell. 1990;63:225–233. - PubMed

Publication types

MeSH terms