

Fluxome analysis using GC-MS
- PMID: 17286851
- PMCID: PMC1805451
- DOI: 10.1186/1475-2859-6-6
Fluxome analysis using GC-MS
Abstract
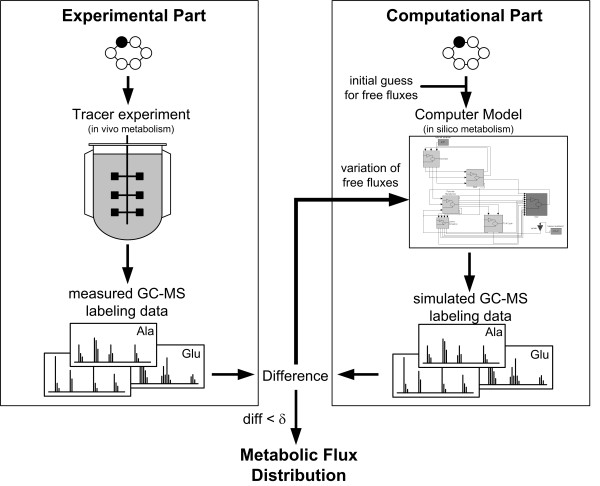
Fluxome analysis aims at the quantitative analysis of in vivo carbon fluxes in metabolic networks, i. e. intracellular activities of enzymes and pathways. It allows investigating the effects of genetic or environmental modifications and thus precisely provides a global perspective on the integrated genetic and metabolic regulation within the intact metabolic network. The experimental and computational approaches developed in this area have revealed fascinating insights into metabolic properties of various biological systems. Most of the comprehensive approaches for metabolic flux studies today involve isotopic tracer studies and GC-MS for measurement of the labeling pattern of metabolites. Initially developed and applied mainly in the field of biomedicine these GC-MS based metabolic flux approaches have been substantially extended and optimized during recent years and today display a key technology in metabolic physiology and biotechnology.
Figures
Similar articles
-
Metabolic fluxes and beyond-systems biology understanding and engineering of microbial metabolism.Appl Microbiol Biotechnol. 2010 Nov;88(5):1065-75. doi: 10.1007/s00253-010-2854-2. Epub 2010 Sep 7. Appl Microbiol Biotechnol. 2010. PMID: 20821203 Review.
-
Isotope-Assisted Metabolic Flux Analysis: A Powerful Technique to Gain New Insights into the Human Metabolome in Health and Disease.Metabolites. 2022 Nov 4;12(11):1066. doi: 10.3390/metabo12111066. Metabolites. 2022. PMID: 36355149 Free PMC article. Review.
-
Optimal tracers for parallel labeling experiments and 13C metabolic flux analysis: A new precision and synergy scoring system.Metab Eng. 2016 Nov;38:10-18. doi: 10.1016/j.ymben.2016.06.001. Epub 2016 Jun 4. Metab Eng. 2016. PMID: 27267409 Free PMC article.
-
Glucose-methanol co-utilization in Pichia pastoris studied by metabolomics and instationary ¹³C flux analysis.BMC Syst Biol. 2013 Feb 28;7:17. doi: 10.1186/1752-0509-7-17. BMC Syst Biol. 2013. PMID: 23448228 Free PMC article.
-
13C metabolic flux analysis of microbial and mammalian systems is enhanced with GC-MS measurements of glycogen and RNA labeling.Metab Eng. 2016 Nov;38:65-72. doi: 10.1016/j.ymben.2016.06.007. Epub 2016 Jun 22. Metab Eng. 2016. PMID: 27343680 Free PMC article.
Cited by
-
Metabolic Regulation of a Bacterial Cell System with Emphasis on Escherichia coli Metabolism.ISRN Biochem. 2013 Feb 18;2013:645983. doi: 10.1155/2013/645983. eCollection 2013. ISRN Biochem. 2013. PMID: 25937963 Free PMC article. Review.
-
Metabolic flux analysis in Ashbya gossypii using 13C-labeled yeast extract: industrial riboflavin production under complex nutrient conditions.Microb Cell Fact. 2018 Oct 16;17(1):162. doi: 10.1186/s12934-018-1003-y. Microb Cell Fact. 2018. PMID: 30326916 Free PMC article.
-
Flux-p: automating metabolic flux analysis.Metabolites. 2012 Nov 12;2(4):872-90. doi: 10.3390/metabo2040872. Metabolites. 2012. PMID: 24957766 Free PMC article.
-
13C-assisted metabolic flux analysis to investigate heterotrophic and mixotrophic metabolism in Cupriavidus necator H16.Metabolomics. 2018;14(1):9. doi: 10.1007/s11306-017-1302-z. Epub 2017 Dec 4. Metabolomics. 2018. PMID: 29238275 Free PMC article.
-
Integration of flux measurements and pharmacological controls to optimize stable isotope-resolved metabolomics workflows and interpretation.Sci Rep. 2019 Sep 23;9(1):13705. doi: 10.1038/s41598-019-50183-3. Sci Rep. 2019. PMID: 31548575 Free PMC article.
References
-
- Kelleher JK. Estimating gluconeogenesis with [U-13C]glucose: molecular condensation requires a molecular approach. Am J Physiol. 1999;277:E395–400. - PubMed
-
- Becker J, Klopprogge C, Zelder O, Heinzle E, Wittmann C. Amplified expression of fructose 1,6-bisphosphatase in Corynebacterium glutamicum increases in vivo flux through the pentose phosphate pathway and lysine production on different carbon sources. Appl Environ Microbiol. 2005;71:8587–8596. doi: 10.1128/AEM.71.12.8587-8596.2005. - DOI - PMC - PubMed
-
- Becker J, Klopprogge C, Zelder O, Wittmann C. Metabolic flux engineering of L-lysine production in Corynebacterium glutamicum - overexpression and modification of glucose 6-phosphate dehydrogenase. J Biotechnol. 2006;submitted - PubMed
LinkOut - more resources
Full Text Sources
Miscellaneous
