

Ranked Adjusted Rand: integrating distance and partition information in a measure of clustering agreement
- PMID: 17286861
- PMCID: PMC1802093
- DOI: 10.1186/1471-2105-8-44
Ranked Adjusted Rand: integrating distance and partition information in a measure of clustering agreement
Abstract
Background: Biological information is commonly used to cluster or classify entities of interest such as genes, conditions, species or samples. However, different sources of data can be used to classify the same set of entities and methods allowing the comparison of the performance of two data sources or the determination of how well a given classification agrees with another are frequently needed, especially in the absence of a universally accepted "gold standard" classification.
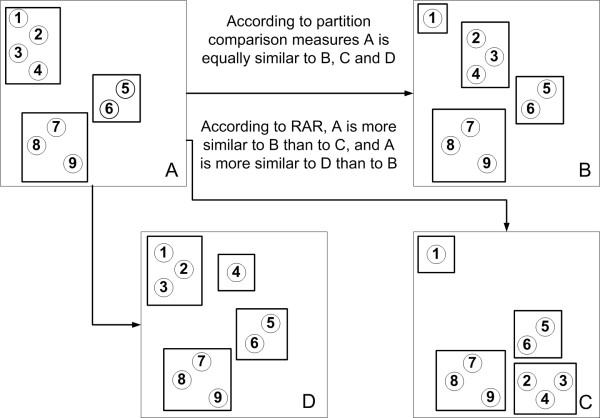
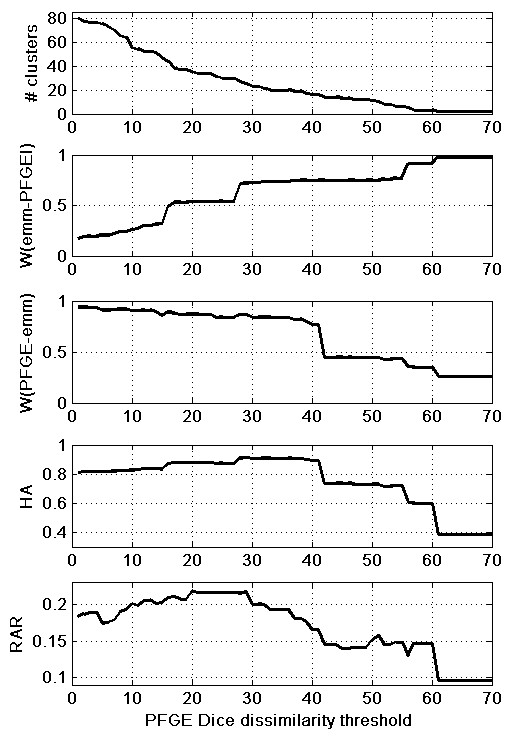
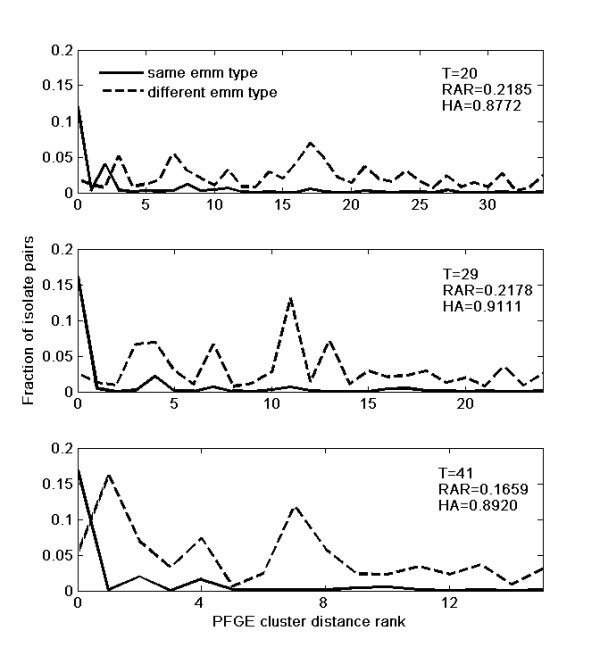
Results: Here, we describe a novel measure--the Ranked Adjusted Rand (RAR) index. RAR differs from existing methods by evaluating the extent of agreement between any two groupings, taking into account the intercluster distances. This characteristic is relevant to evaluate cases of pairs of entities grouped in the same cluster by one method and separated by another. The latter method may assign them to close neighbour clusters or, on the contrary, to clusters that are far apart from each other. RAR is applicable even when intercluster distance information is absent for both or one of the groupings. In the first case, RAR is equal to its predecessor, Adjusted Rand (HA) index. Artificially designed clusterings were used to demonstrate situations in which only RAR was able to detect differences in the grouping patterns. A study with larger simulated clusterings ensured that in realistic conditions, RAR is effectively integrating distance and partition information. The new method was applied to biological examples to compare 1) two microbial typing methods, 2) two gene regulatory network distances and 3) microarray gene expression data with pathway information. In the first application, one of the methods does not provide intercluster distances while the other originated a hierarchical clustering. RAR proved to be more sensitive than HA in the choice of a threshold for defining clusters in the hierarchical method that maximizes agreement between the results of both methods.
Conclusion: RAR has its major advantage in combining cluster distance and partition information, while the previously available methods used only the latter. RAR should be used in the research problems were HA was previously used, because in the absence of inter cluster distance effects it is an equally effective measure, and in the presence of distance effects it is a more complete one.
Figures
Similar articles
-
Combining multiple clusterings using evidence accumulation.IEEE Trans Pattern Anal Mach Intell. 2005 Jun;27(6):835-50. doi: 10.1109/TPAMI.2005.113. IEEE Trans Pattern Anal Mach Intell. 2005. PMID: 15943417
-
Biclustering via optimal re-ordering of data matrices in systems biology: rigorous methods and comparative studies.BMC Bioinformatics. 2008 Oct 27;9:458. doi: 10.1186/1471-2105-9-458. BMC Bioinformatics. 2008. PMID: 18954459 Free PMC article.
-
Penalized and weighted K-means for clustering with scattered objects and prior information in high-throughput biological data.Bioinformatics. 2007 Sep 1;23(17):2247-55. doi: 10.1093/bioinformatics/btm320. Epub 2007 Jun 27. Bioinformatics. 2007. PMID: 17597097
-
A new distance measure for model-based sequence clustering.IEEE Trans Pattern Anal Mach Intell. 2009 Jul;31(7):1325-31. doi: 10.1109/TPAMI.2008.268. IEEE Trans Pattern Anal Mach Intell. 2009. PMID: 19443928
-
FINE: fisher information nonparametric embedding.IEEE Trans Pattern Anal Mach Intell. 2009 Nov;31(11):2093-8. doi: 10.1109/TPAMI.2009.67. IEEE Trans Pattern Anal Mach Intell. 2009. PMID: 19762935
Cited by
-
Genomic investigation of Lactococcus formosensis, Lactococcus garvieae, and Lactococcus petauri reveals differences in species distribution by human and animal sources.Microbiol Spectr. 2024 Jun 4;12(6):e0054124. doi: 10.1128/spectrum.00541-24. Epub 2024 Apr 30. Microbiol Spectr. 2024. PMID: 38687062 Free PMC article.
-
Development of a Peptide-Based Multiepitope Vaccine from the SARS-CoV-2 Spike Protein for Targeted Immune Response Against COVID-19.Protein Pept Lett. 2025;32(4):299-311. doi: 10.2174/0109298665364226250328084245. Protein Pept Lett. 2025. PMID: 40231512
-
A confidence interval for the wallace coefficient of concordance and its application to microbial typing methods.PLoS One. 2008;3(11):e3696. doi: 10.1371/journal.pone.0003696. Epub 2008 Nov 11. PLoS One. 2008. PMID: 19002246 Free PMC article.
-
Performance Comparison Between Fourier-Transform Infrared Spectroscopy-based IR Biotyper and Matrix-Assisted Laser Desorption/Ionization Time-of-Flight Mass Spectrometry for Strain Diversity.Ann Lab Med. 2023 Mar 1;43(2):174-179. doi: 10.3343/alm.2023.43.2.174. Epub 2022 Oct 25. Ann Lab Med. 2023. PMID: 36281511 Free PMC article.
-
Evaluation of jackknife and bootstrap for defining confidence intervals for pairwise agreement measures.PLoS One. 2011;6(5):e19539. doi: 10.1371/journal.pone.0019539. Epub 2011 May 18. PLoS One. 2011. PMID: 21611165 Free PMC article.
References
-
- Rohlf FJ. Methods of Comparing Classifications. Annu Rev Ecol Syst. 1974;5:101–113. doi: 10.1146/annurev.es.05.110174.000533. - DOI
-
- Rand WM. Objective criteria for the evaluation of clustering methods. Journal of the American Statistical Association. 1973;66:846–850. doi: 10.2307/2284239. - DOI
-
- Fowlkes EB, Mallows CL. A method for comparing two hierarchical clusterings. Journal of the American Statistical Association. 1983;78:553–569. doi: 10.2307/2288117. - DOI
-
- Hubert L, Arabie P. Comparing partitions. Journal of Classification. 1985;2:193–218. doi: 10.1007/BF01908075. - DOI
-
- Sneath PH, Sokal RR. Numerical Taxonomy. San Francisco: Freeman; 1973.
Publication types
MeSH terms
LinkOut - more resources
Full Text Sources
