

Rodent brain and heart catecholamine levels are altered by different models of copper deficiency
- PMID: 17287146
- PMCID: PMC1903347
- DOI: 10.1016/j.cbpc.2006.12.013
Rodent brain and heart catecholamine levels are altered by different models of copper deficiency
Abstract
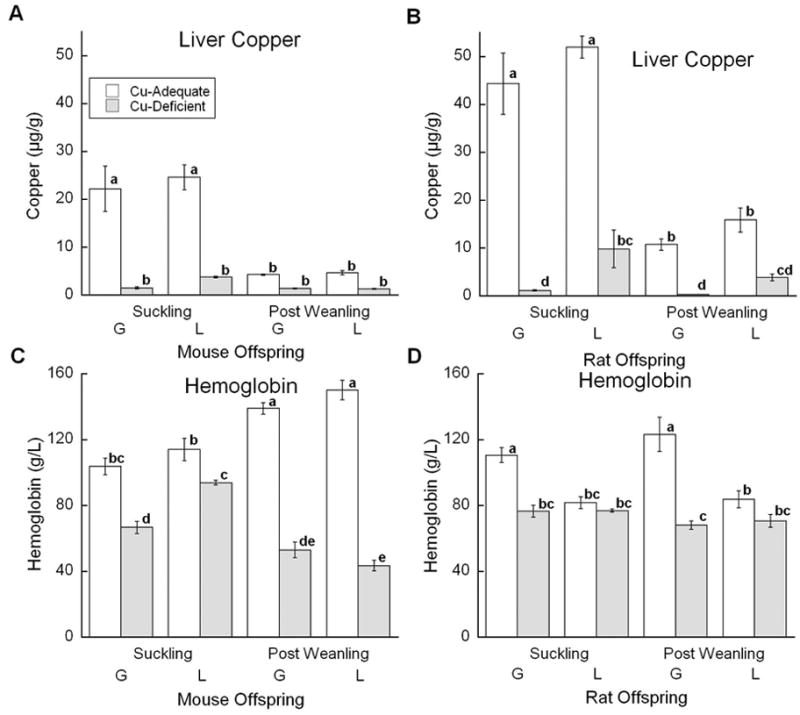
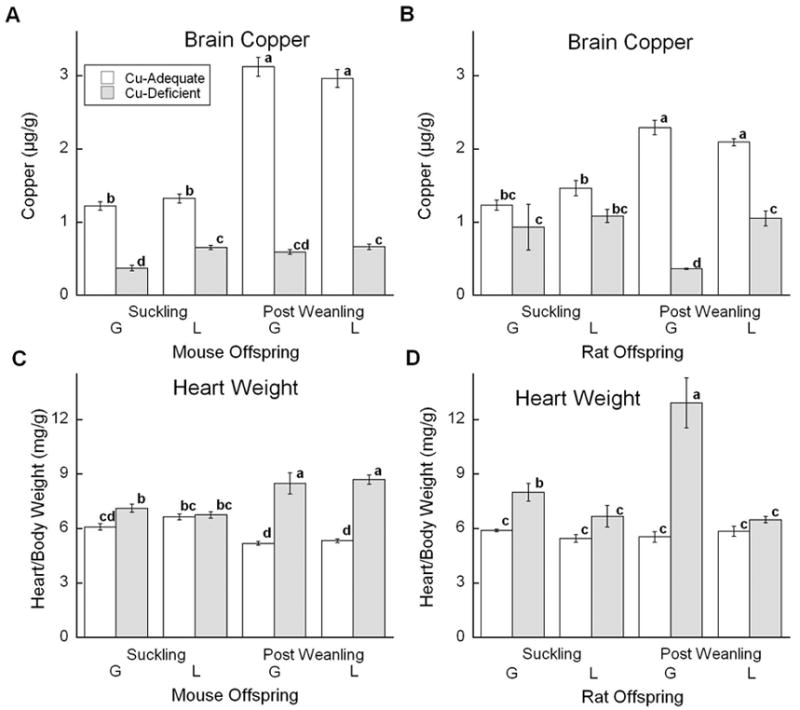
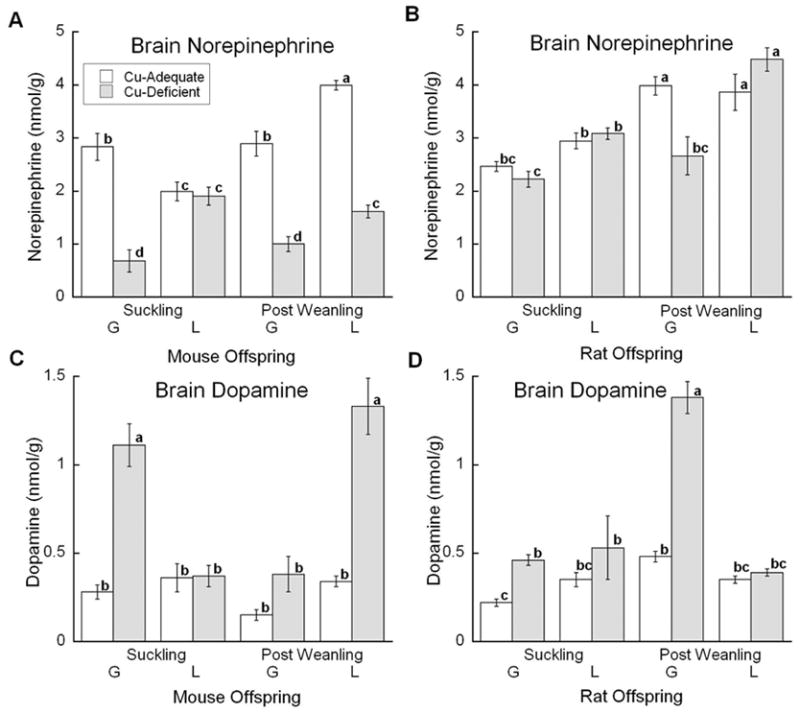
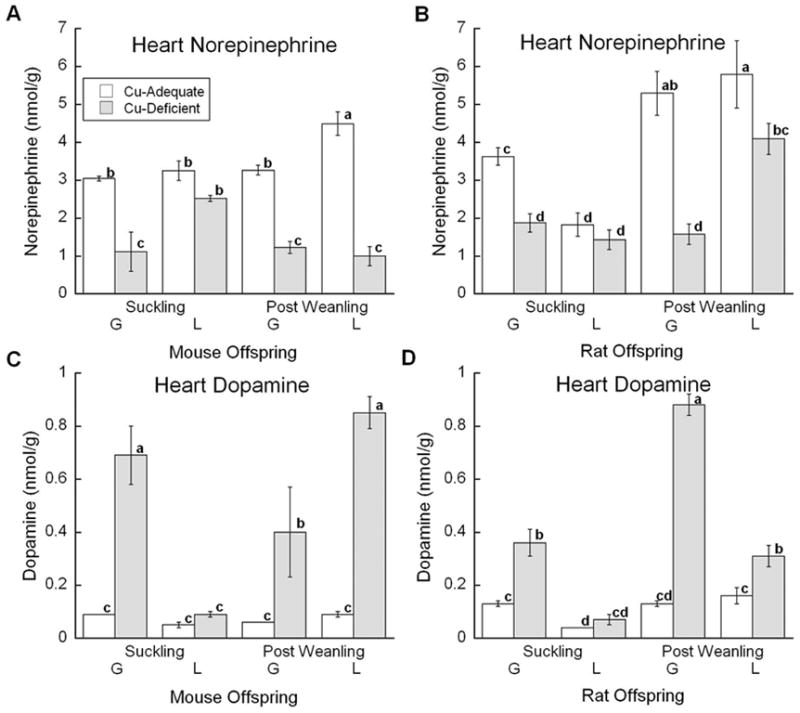
Limiting dopamine beta-monooxygenase results in lower norepinephrine (NE) and higher dopamine (DA) concentrations in copper-deficient Cu- tissues compared to copper-adequate Cu+ tissues. Mice and rat offspring were compared to determine the effect of differences in dietary copper Cu deficiency started during gestation or lactation on catecholamine, NE and DA, content in brain and heart. Holtzman rat and Hsd:ICR (CD-1) outbred albino mouse dams were fed a Cu- diet and drank deionized water or Cu supplemented water. Offspring were sampled at time points between postnatal ages 12 and 27. For both rat and mouse Cu- tissue, NE and DA changes were greater at later ages. Though Cu restriction began earlier in rats than mice in the gestational model, brain NE reduction was more severe in Cu- mice than Cu- rats. Cardiac NE reduction was similar in Cu- rodents in the gestation models. In the lactation model, mouse catecholamines were altered more than rat catecholamines. Furthermore, following lactational Cu deficiency Cu- mice were anemic and exhibited cardiac hypertrophy, Cu- rats displayed neither phenotype. Within a species, changes were more severe and proportional to the length of Cu deprivation. Lactational Cu deficiency in mice had greater consequences than in rats.
Figures
Similar articles
-
Cardiac catecholamine metabolism in copper-deficient rats.J Nutr. 1991 Apr;121(4):474-83. doi: 10.1093/jn/121.4.474. J Nutr. 1991. PMID: 1826130
-
Copper deficient rats and mice both develop anemia but only rats have lower plasma and brain iron levels.Comp Biochem Physiol C Toxicol Pharmacol. 2008 Apr;147(3):316-23. doi: 10.1016/j.cbpc.2007.11.008. Epub 2007 Dec 4. Comp Biochem Physiol C Toxicol Pharmacol. 2008. PMID: 18178529 Free PMC article.
-
Effect of dietary copper deficiency on the distribution of dopamine and norepinephrine in mice and rats.J Nutr Biochem. 1990 Mar;1(3):149-54. doi: 10.1016/0955-2863(90)90015-d. J Nutr Biochem. 1990. PMID: 15539197
-
Gender differences in immune competence during copper deficiency.Nutr Rev. 1992 Apr;50(4 ( Pt 1)):114-6. doi: 10.1111/j.1753-4887.1992.tb01300.x. Nutr Rev. 1992. PMID: 1614640 Review.
-
Sex differences in the survival of copper-deficient rats.Nutr Rev. 1987 Aug;45(8):250-1. doi: 10.1111/j.1753-4887.1987.tb02692.x. Nutr Rev. 1987. PMID: 2957620 Review. No abstract available.
Cited by
-
Cardiac copper deficiency activates a systemic signaling mechanism that communicates with the copper acquisition and storage organs.Cell Metab. 2010 May 5;11(5):353-63. doi: 10.1016/j.cmet.2010.04.003. Cell Metab. 2010. PMID: 20444417 Free PMC article.
-
Levels of plasma ceruloplasmin protein are markedly lower following dietary copper deficiency in rodents.Comp Biochem Physiol C Toxicol Pharmacol. 2010 May;151(4):473-9. doi: 10.1016/j.cbpc.2010.02.005. Epub 2010 Feb 16. Comp Biochem Physiol C Toxicol Pharmacol. 2010. PMID: 20170749 Free PMC article.
-
Extracellular norepinephrine, norepinephrine receptor and transporter protein and mRNA levels are differentially altered in the developing rat brain due to dietary iron deficiency and manganese exposure.Brain Res. 2009 Jul 24;1281:1-14. doi: 10.1016/j.brainres.2009.05.050. Epub 2009 May 28. Brain Res. 2009. PMID: 19481535 Free PMC article.
-
Charting the travels of copper in eukaryotes from yeast to mammals.Biochim Biophys Acta. 2012 Sep;1823(9):1580-93. doi: 10.1016/j.bbamcr.2012.02.011. Epub 2012 Feb 24. Biochim Biophys Acta. 2012. PMID: 22387373 Free PMC article. Review.
-
Overlapping and Distinct Features of Cardiac Pathology in Inherited Human and Murine Ether Lipid Deficiency.Int J Mol Sci. 2023 Jan 18;24(3):1884. doi: 10.3390/ijms24031884. Int J Mol Sci. 2023. PMID: 36768204 Free PMC article.
References
-
- Bennetts HW, Chapman FE. Copper deficiency in sheep in Western Australia: A preliminary account of the etiology of enzootic ataxia of lambs and an anemia of ewes. Aust Vet J. 1937;13:138–149.
-
- Carlton WW, Kelly WA. Neural lesions in the offspring of female rats fed a copper-deficient diet. J Nutr. 1969;97:42–52. - PubMed
-
- Chen H, Huang G, Su T, Gao H, Attieh ZK, McKie AT, Anderson GJ, Vulpe CD. Decreased hephaestin activity in the intestine of copper-deficient mice causes systemic iron deficiency. J Nutr. 2006;136:1236–1241. - PubMed
-
- Cohen NL, Keen CL, Hurley LS, Lonnerdal B. Determinants of copper-deficiency anemia in rats. J Nutr. 1985;115:710–725. - PubMed
-
- Dallman PR, Goodman JR. Enlargement of mitochondrial compartment in iron and copper deficiency. Blood. 1970;35:496–505. - PubMed
Publication types
MeSH terms
Substances
Grants and funding
LinkOut - more resources
Full Text Sources
