Antigenic and genetic evolution of swine influenza A (H3N2) viruses in Europe
- PMID: 17287258
- PMCID: PMC1866135
- DOI: 10.1128/JVI.02458-06
Antigenic and genetic evolution of swine influenza A (H3N2) viruses in Europe
Abstract
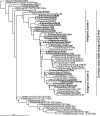
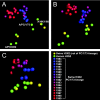
In the early 1970s, a human influenza A/Port Chalmers/1/73 (H3N2)-like virus colonized the European swine population. Analyses of swine influenza A (H3N2) viruses isolated in The Netherlands and Belgium revealed that in the early 1990s, antigenic drift had occurred, away from A/Port Chalmers/1/73, the strain commonly used in influenza vaccines for pigs. Here we show that Italian swine influenza A (H3N2) viruses displayed antigenic and genetic changes similar to those observed in Northern European viruses in the same period. We used antigenic cartography methods for quantitative analyses of the antigenic evolution of European swine H3N2 viruses and observed a clustered virus evolution as seen for human viruses. Although the antigenic drift of swine and human H3N2 viruses has followed distinct evolutionary paths, potential cluster-differentiating amino acid substitutions in the influenza virus surface protein hemagglutinin (HA) were in part the same. The antigenic evolution of swine viruses occurred at a rate approximately six times slower than the rate in human viruses, even though the rates of genetic evolution of the HA at the nucleotide and amino acid level were similar for human and swine H3N2 viruses. Continuous monitoring of antigenic changes is recommended to give a first indication as to whether vaccine strains may need updating. Our data suggest that humoral immunity in the population plays a smaller role in the evolutionary selection processes of swine H3N2 viruses than in human H3N2 viruses.
Figures


References
-
- Aymard, M., J. M. Gourreau, C. Kaiser, M. Fontaine, F. Madec, and J. P. Tillon. 1985. Les marqueurs immunovirologiques du risque d'influenza A H3N2 chez les porcs. Rev. Epidémiol. Santé Publique 33:283-291. - PubMed
-
- Bikour, M. H., E. H. Frost, S. Deslandes, B. Talbot, J. M. Weber, and Y. Elazhary. 1995. Recent H3N2 swine influenza virus with haemagglutinin and nucleoprotein genes similar to 1975 human strains. J. Gen. Virol. 76:697-703. - PubMed
-
- Campitelli, L., I. Donatelli, E. Foni, M. R. Castrucci, C. Fabiani, Y. Kawaoka, S. Krauss, and R. G. Webster. 1997. Continued evolution of H1N1 and H3N2 influenza viruses in pigs in Italy. Virology 232:310-318. - PubMed
-
- Castrucci, M. R., L. Campitelli, A. Ruggieri, G. Barigazzi, L. Sidoli, R. Daniels, J. S. Oxford, and I. Donatelli. 1994. Antigenic and sequence analysis of H3 influenza virus haemagglutinins from pigs in Italy. J. Gen. Virol. 75:371-379. - PubMed
Publication types
MeSH terms
Substances
Associated data
- Actions
- Actions
- Actions
- Actions
- Actions
- Actions
- Actions
- Actions
- Actions
- Actions
- Actions
- Actions
- Actions
- Actions
- Actions
- Actions
Grants and funding
LinkOut - more resources
Full Text Sources
Other Literature Sources

