

Kinetic models of redox-coupled proton pumping
- PMID: 17287344
- PMCID: PMC1892981
- DOI: 10.1073/pnas.0611114104
Kinetic models of redox-coupled proton pumping
Abstract
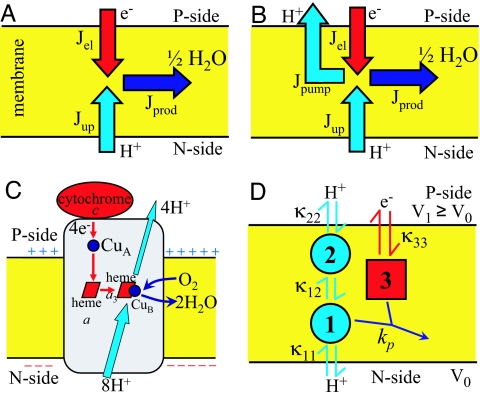
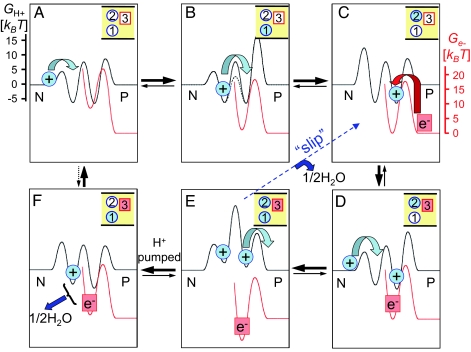
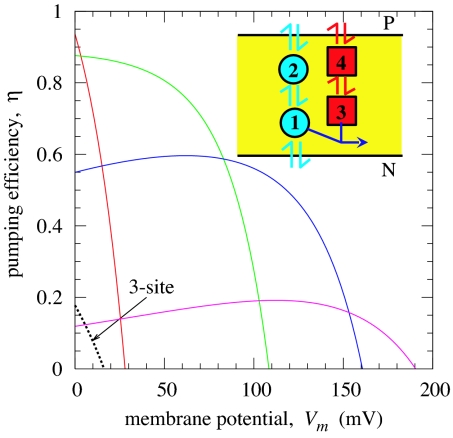
Cytochrome c oxidase, the terminal enzyme of the respiratory chain, pumps protons across the inner mitochondrial membrane against an opposing electrochemical gradient by reducing oxygen to water. To explore the fundamental mechanisms of such redox-coupled proton pumps, we develop kinetic models at the single-molecule level consistent with basic physical principles. We demonstrate that pumping against potentials >150 mV can be achieved purely through electrostatic couplings, given an asymmetric arrangement of charge centers; however, nonlinear gates are essential for highly efficient real enzymes. The fundamental requirements for proton pumping identified here highlight a possible evolutionary origin of cytochrome c oxidase pumping. The general design principles are relevant also for other molecular machines and suggest future applications in biology-inspired fuel cells.
Conflict of interest statement
The authors declare no conflict of interest.
Figures
Similar articles
-
Electrostatic study of the proton pumping mechanism in bovine heart cytochrome C oxidase.J Am Chem Soc. 2004 Feb 18;126(6):1858-71. doi: 10.1021/ja038267w. J Am Chem Soc. 2004. PMID: 14871119
-
Electrostatic control of proton pumping in cytochrome c oxidase.Biochim Biophys Acta. 2008 Mar;1777(3):277-84. doi: 10.1016/j.bbabio.2007.11.010. Epub 2007 Dec 14. Biochim Biophys Acta. 2008. PMID: 18177731
-
Proton pumping mechanism and catalytic cycle of cytochrome c oxidase: Coulomb pump model with kinetic gating.FEBS Lett. 2004 May 21;566(1-3):126-30. doi: 10.1016/j.febslet.2004.04.016. FEBS Lett. 2004. PMID: 15147881
-
A cooperative model for proton pumping in cytochrome c oxidase.Biochim Biophys Acta. 2004 Apr 12;1655(1-3):353-64. doi: 10.1016/j.bbabio.2003.06.002. Biochim Biophys Acta. 2004. PMID: 15100051 Review.
-
Proton-pumping mechanism of cytochrome c oxidase: a kinetic master-equation approach.Biochim Biophys Acta. 2012 Apr;1817(4):526-36. doi: 10.1016/j.bbabio.2011.09.004. Epub 2011 Sep 16. Biochim Biophys Acta. 2012. PMID: 21946020 Free PMC article. Review.
Cited by
-
Analyzing the electrogenicity of cytochrome c oxidase.Proc Natl Acad Sci U S A. 2016 Jul 12;113(28):7810-5. doi: 10.1073/pnas.1608118113. Epub 2016 Jun 28. Proc Natl Acad Sci U S A. 2016. PMID: 27357681 Free PMC article.
-
pH signature for the responses of arbuscular mycorrhizal fungi to external stimuli.Plant Signal Behav. 2008 Oct;3(10):850-2. doi: 10.4161/psb.3.10.5992. Plant Signal Behav. 2008. PMID: 19704519 Free PMC article.
-
Water-Gated Proton Transfer Dynamics in Respiratory Complex I.J Am Chem Soc. 2020 Aug 12;142(32):13718-13728. doi: 10.1021/jacs.0c02789. Epub 2020 Jul 30. J Am Chem Soc. 2020. PMID: 32643371 Free PMC article.
-
Water exit pathways and proton pumping mechanism in B-type cytochrome c oxidase from molecular dynamics simulations.Biochim Biophys Acta. 2016 Sep;1857(9):1594-1606. doi: 10.1016/j.bbabio.2016.06.005. Epub 2016 Jun 16. Biochim Biophys Acta. 2016. PMID: 27317965 Free PMC article.
-
Exploration of the cytochrome c oxidase pathway puzzle and examination of the origin of elusive mutational effects.Biochim Biophys Acta. 2011 Apr;1807(4):413-26. doi: 10.1016/j.bbabio.2011.01.004. Epub 2011 Jan 10. Biochim Biophys Acta. 2011. PMID: 21232525 Free PMC article.
References
-
- Wikström M. Nature. 1977;266:271–273. - PubMed
-
- Babcock GT, Wikström M. Nature. 1992;356:301–309. - PubMed
-
- Iwata S, Ostermeier C, Ludwig B, Michel H. Nature. 1995;376:660–669. - PubMed
-
- Tsukihara T, Aoyama H, Yamashita E, Tomizaki T, Yamaguchi H, Shinzawa-Itoh K, Nakashima R, Yaono R, Yoshikawa S. Science. 1995;269:1069–1074. - PubMed
-
- Zaslavsky D, Gennis RB. Biochim Biophys Acta. 2000;1458:164–179. - PubMed
MeSH terms
Substances
LinkOut - more resources
Full Text Sources
