. 2007 Apr;97(4):2663-75.
doi: 10.1152/jn.00308.2006. Epub 2007 Feb 7.

Motor strategies used by rats spinalized at birth to maintain stance in response to imposed perturbations

Affiliations

Motor strategies used by rats spinalized at birth to maintain stance in response to imposed perturbations

Simon F Giszter et al. J Neurophysiol. 2007 Apr.

Abstract

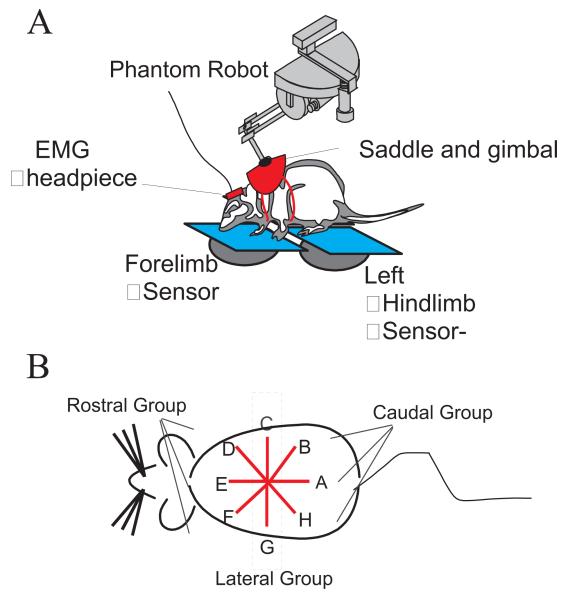
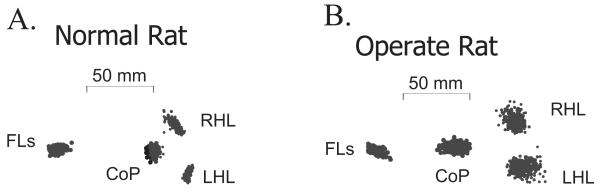
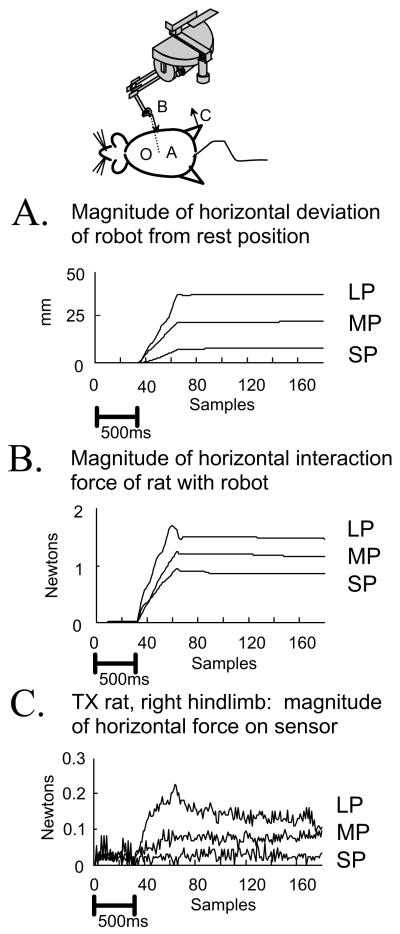
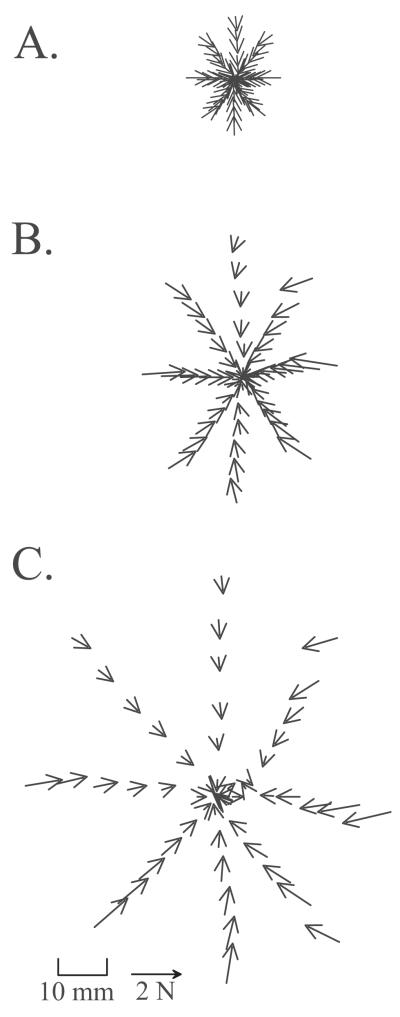
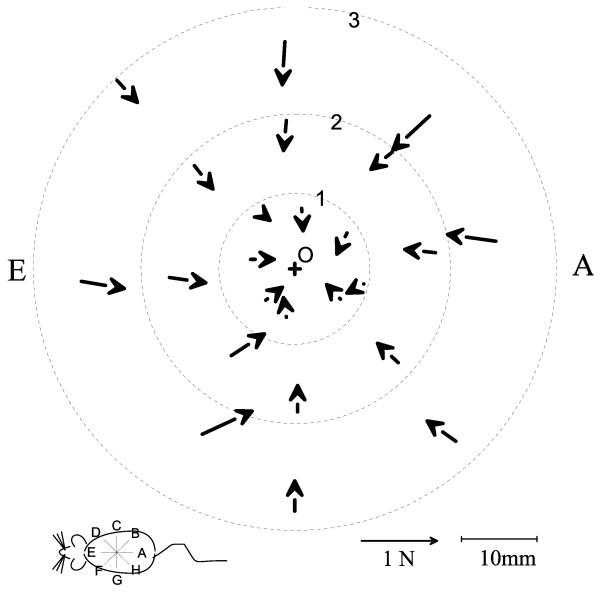
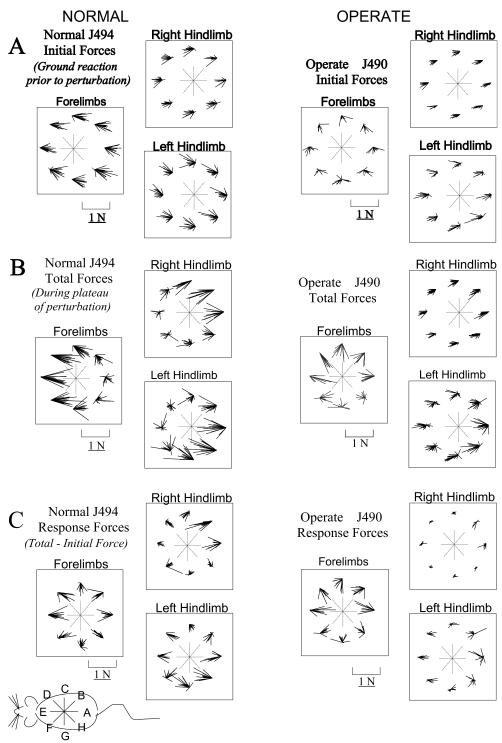
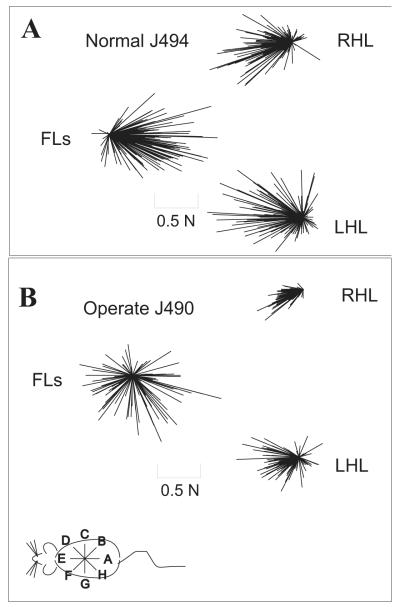
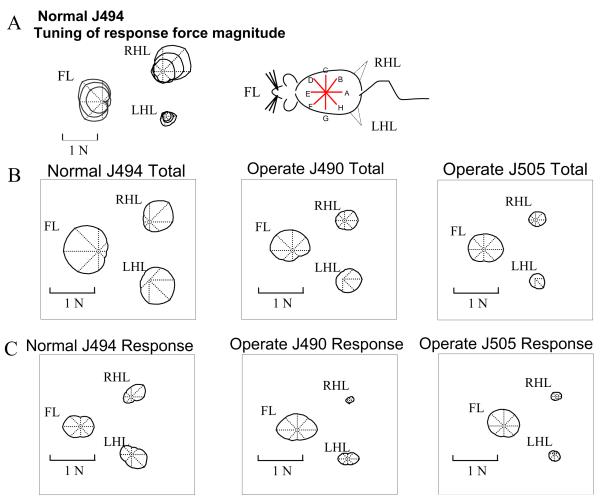
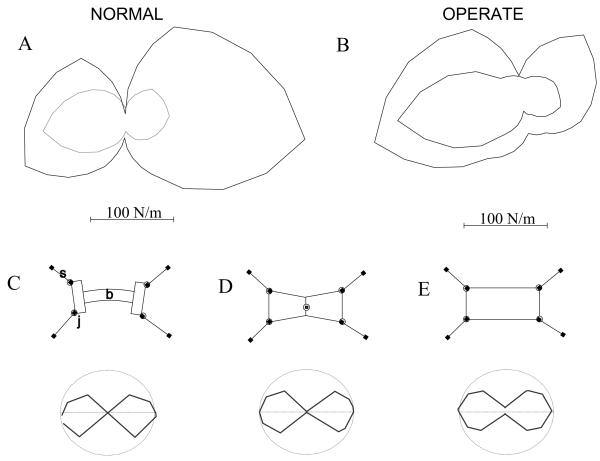
Some rats spinalized P1/P2 achieve autonomous weight-supported locomotion and quiet stance as adults. We used force platforms and robot-applied perturbations to test such spinalized rats (n = 6) that exhibited both weight-supporting locomotion and stance, and also normal rats (n = 8). Ground reaction forces in individual limbs and the animals' center of pressure were examined. In normal rats, both forelimbs and hindlimbs participated actively to control horizontal components of ground reaction forces. Rostral perturbations increased forelimb ground reaction forces and caudal perturbations increased hindlimb ground reaction forces. Operate rats carried 60% body weight on the forelimbs and had a more rostral center of pressure placement. The pattern in normal rats was to carry significantly more weight on the hindlimbs in quiet stance (roughly 60%). The strategy of operate rats to compensate for perturbations was entirely in forelimbs; as a result, the hindlimbs were largely isolated from the perturbation. Stiffness magnitude of the whole body was measured: its magnitude was hourglass shaped, with the principal axis oriented rostrocaudally. Operate rats were significantly less stiff--only 60-75% of normal rats' stiffness. The injured rats adopt a stance strategy that isolates the hindlimbs from perturbation and may thus prevent hindlimb loadings. Such loadings could initiate reflex stepping, which we observed. This might activate lumbar pattern generators used in their locomotion. Adult spinalized rats never achieve independent hindlimb weight-supported stance. The stance strategy of the P1 spinalized rats differed strongly from the behavior of intact rats and may be difficult for rats spinalized as adults to master.


Figures

Figure 1
Figure 1
A: Diagram of the testing paradigm. The Phantom™ robot was attached to the rat via a saddle and jacket mounted on the rat’s torso, near the shoulders. The saddle was attached to the robot with a gimbal. The rats stood with their two forelimbs on one force-plate sensor and each hindlimb on an individual force-plate sensor. The rat was motivated to drink from a drinking tube for a water reward. When active, the robot imposed a horizontal elastic field on the rat’s torso at the thorax. On perturbation trials the equilibrium of this field was moved in the commanded direction by a pre-specified distance. The rat either resisted and compensated for, or yielded to, the resulting directional interaction forces. B: A diagram of a dorsal view of a rat depicting directions of perturbations. In all figures the rat’s head is to the left, and the perturbations are as indicated in A – H. The DEF group of directions constitute rostral perturbations and HAB group of direction are caudal perturbations. Perturbations began at A and proceeded to H. Perturbations were applied with increasing magnitude of the equilibrium motion in each set: first perturbation set 1.9cm, second 3.8cm, third 5.7cm.
Figure 2
Figure 2
Plots of the center of pressure and force application of the rat’s feet on each individual sensor (FLs: forelimb, RHL right hindlimb, LHL left hindlimb) and the resultant center of pressure (CoP) of the rat as a whole on the support surface. The CoP was computed from the individual sensor force applications. The CoP’s small fluctuations through time form the ‘stabilogram’. Data are shown for (A) a normal rat J494, and (B) an operate rat J490, in an unperturbed resting state before trials began. The CoP fluctuations observed over 500 ms are shown as unconnected dots. The CoP of the normal rat is more caudal than the operate rat’s CoP and shows less rostrocaudal variation in position or dispersion. The difference in position was statistically significant (see text and Table1). The points of application of force by the hindlimbs of the normal rat show directional variations that were absent in the injured rats, and probably associated with hindlimb postural differences between normal and operate rats.
Figure 3
Figure 3
Plots of the responses in perturbation trials for a single direction perturbation applied to an operate (TX) rat’s stance. LP large perturbation, MP medium perturbation, SP small perturbation. Shown are :(A) the distance over time of the position of the phantom tip from rest. (B), the magnitude of the horizontal plane interaction force between an operate rat and the Phantom. (C) the magnitude of the horizontal plane ground reaction force at the right hindlimb force-plate sensor. Rats picked a strategy for how to distribute horizontal (‘shear’) forces among the individual leg’s ground reaction forces. Data is shown for operate rat number J490 (CoP shown in Figure 2). Data are plotted during each size perturbation, all in direction D (See Fig 1). Bias resting force was removed from the ground reaction force sensor and position is referenced to the rest posture. Data is plotted at each force sample acquisition from the sensors (15.8ms increments). Time is displayed both as the sample count, and as a 500ms scale bar in panel A. Note the small hindlimb force responses in panel C relative to the applied force in panel B in this rat.
Figure 4
Figure 4
Vector plots of the interaction force of rat and robot plotted at the robot tip position at intervals of 30ms through time. All directions in each of three perturbations sizes are shown [Commanded perturbation distances of elastic robot equilibrium : A) 19mm; B) 38mm; C) 57mm]. Data are for normal rat number J494 (CoP shown in Figure 2). Note the relatively larger excursion to force magnitude relationship that can be seen in C relative to A.
Figure 5
Figure 5
The maximum active interaction force vectors between the rat and the robot (see also figure 2 and 4). Data from a normal rat, J494, in which the initial pre-perturbation interaction of the phantom and the rat was low on each set of trials. (+: location of robot equilibrium before perturbations, O: approximate rest location of rat before perturbations). The vectors show the peak forces generated by the rat after subtraction of resting forces. The vectors displayed were measured at the peak excursion produced by the Phantom for each perturbation. Each ring of vectors represents a perturbation size (1: 19mm, 2: 38mm, 3: 57mm ). Each line of 3 vectors represents a perturbation direction. The interaction forces are shown plotted as vectors at the measurement point to which the robot moved against the rat’s resistance. Force rises with the size of the perturbation, though not proportionately. Note also that forces converge approximately toward the rest position of the rat, but not precisely, since these represent active response forces.
Figure 6
Figure 6
Plots of raw A. Initial (pre-perturbation), B. Total (peak perturbation, see figure 3), and C. Response (Total-Initial) horizontal plane components of ground reaction force vectors measured from the force-plates. Groups of vectors are shown for the combined forelimbs force-plate and for each hindlimb forceplate. Within each group the measurements are organized into 8 clusters based on the direction of perturbation, as indicated by the central compass. Vectors originate at a common fixed point with no physical significance besides indicating direction of perturbation in the cluster trials. The small schematic of the rat in the lower left corner provides the orientation of the rat and the perturbations. Initial forces in A represent the horizontal plane shear forces before any perturbation. Total forces in B represent the peak interaction of rat and robot. Response forces in C represent the vector difference of forces in B and A. In A: Note variation of force trial to trial, but the clearly differing patterns of forelimb force in the operate and normal. In B: Note the tendency for horizontal shear loading to be concentrated in either the forelimbs (left clusters (perturbation directtions D, E, F in Figure 1) on forelimb plate) or hindlimbs (rightmost clusters (perturbation directtions B, A, H in Figure 1) on hindlimb plates) in the normal rat. Forces in the forelimbs of operate rats differ in direction, and this concentration of loading in either forelimb or hindlimb is largely absent. In C: Note that Hindlimb response forces in the operate are far smaller than in normals (Significantly so, two tailed t-test, p<0.05). In this data set there is some response in the left hindlimb in the operate.
Figure 7
Figure 7
Plots of raw horizontal total response force vectors for all perturbations in all directions in a normal rat (A) and an operate (B). Forces are plotted for the forelimb (FL) sensor, the right hindlimb (RHL) and left hindlimb (LHL) sensors. These combined data show that there is clear directional clustering of hindlimb forces in both the normals and the operate rats, but clustering of forelimbs directions occurs only in normal rats. In contrast, there is wide directional variability of forelimb forces in operates. This is consistent with forelimb compensation dominating the response adjustment used in operates, which requires force production in all directions in the forelimbs and small or negligible active force changes in the hindlimbs (see Figure 8).
Figure 8
Figure 8
Polar plots of tuning curves of the magnitude of the horizontal forces for different directions of perturbations. The polar plots are centered on the compass center. A: The tuning curves of the three different size perturbations for a single experiment in a normal rat. Tuning did not differ among perturbation sizes. B: The averages of the total force curves of the three different size perturbations for all experiments in a normal rat and in two operate rats. Note the greater directional tuning in the hindlimbs of normal rats as indicated by greater departure from a centered shape. C: The averages of the response force curves of the three different size perturbations for all trials in the normal and the two operate rats depicted in 5B. Normal rat forelimb and hindlimb responses are strongly tuned. In operate rats the hindlimbs show much less directional tuning and have very small hindlimb forces.
Figure 9
Figure 9
A. A polar plot of the magnitude of stiffness of a normal rat J494. Stiffness magnitude is plotted at each direction of each perturbation. This should be distinguished from a linear fit stiffness ellipse, or a full non-linear fit. Our data did not support linear fits and was not sufficiently complete for a full non-linear fit. The inner curve represents the stiffness magnitude during the largest perturbations; the outer curve represents stiffness during the smallest perturbations. Rats exhibited less stiffness to larger perturbation. The polar plot of the magnitude of stiffness had an hourglass shape. The rat was much less stiff laterally. B. Stiffness plot for an operate rat J490. The stiffness of this rat showed rostrocaudal asymmetry as well as non-linearity, with lower stiffness in caudal directions. Nonlinear aspects of stiffness were at least partly attributable to the quadrupedal structure. To show this we tested 3 simple models of horizontal plane quadrupedal stiffness (C-E). Each showed an hourglass pattern magnitude response similar to the biological data. C Stiffness magnitude plot measured as in A and B for a structural model of a rat comprised of compression spring struts, springy rotary hip and shoulders and a stiff but flexible beam to represent the torso. D Stiffness magnitude in a model of rat comprised of legs as in C and a single central compliant trunk joint. This model could show symmetry breaking by flexure at the trunk joint leading to apparent lateral asymmetry of stiffness as sometimes also seen in the rats. E Stiffness of a structural model of a rat with legs as in C and D but using a rigid box as torso. Note persistence of hourglass shaped lateral stiffness, though less prominent compared to C and D.

Similar articles

Cited by

References

    1. Bouyer LJ, Whelan PJ, Pearson KG, Rossignol S. Adaptive locomotor plasticity in chronic spinal cats after ankle extensors neurectomy. J Neurosci. 2001;21(10):3531–41. - PMC - PubMed
    1. Collins JJ, De Luca CJ. Upright, correlated random walks: A statistical-biomechanics approach to the human postural control system. Chaos. 1995 Mar;5(1):57–63. - PubMed
    1. Collins JJ, De Luca CJ. Open-loop and closed-loop control of posture: a random-walk analysis of center-of-pressure trajectories. Exp Brain Res. 1993;95(2):308–18. - PubMed
    1. de Leon RD, Kubasak MD, Phelps PE, Timoszyk WK, Reinkensmeyer DJ, Roy RR, Edgerton VR. Using robotics to teach the spinal cord to walk. Brain Res Brain Res Rev. 2002a;40(1-3):267–73. - PubMed
    1. de Leon RD, Reinkensmeyer DJ, Timoszyk WK, London NJ, Roy RR, Edgerton VR. Use of robotics in assessing the adaptive capacity of the rat lumbar spinal cord. Prog Brain Res. 2002b;137:141–9. - PubMed

Publication types