

Retrograde regulation of GABA transmission by the tonic release of oxytocin and endocannabinoids governs postsynaptic firing
- PMID: 17287507
- PMCID: PMC6673587
- DOI: 10.1523/JNEUROSCI.2676-06.2007
Retrograde regulation of GABA transmission by the tonic release of oxytocin and endocannabinoids governs postsynaptic firing
Abstract
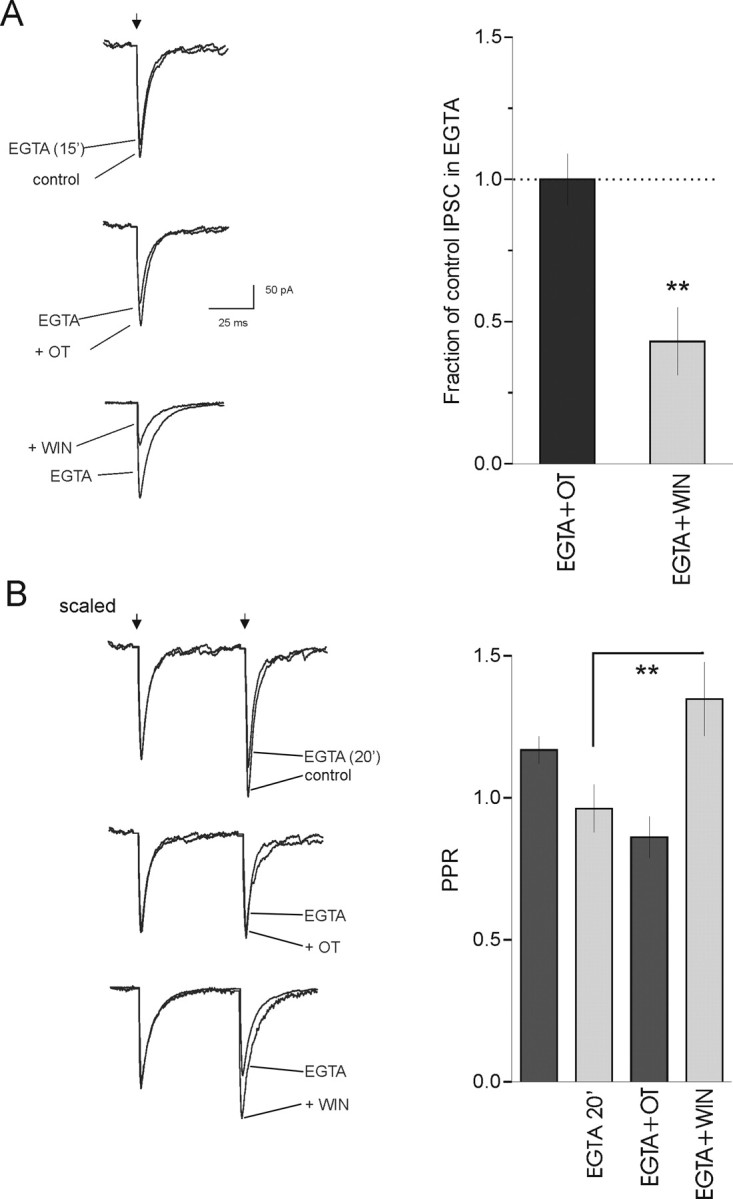
The probability of neurotransmitter release at the nerve terminal is an important determinant of synaptic efficacy. At some central synapses, the postsynaptic, or target, neuron determines neurotransmitter release probability (P(r)) at the presynaptic terminal. The mechanisms responsible for this target-cell dependent control of P(r) have not been elucidated. Using whole-cell patch-clamp recordings from magnocellular neurosecretory cells in the paraventricular and supraoptic nuclei of the hypothalamus, we demonstrate that inhibitory, GABA synapses specifically onto oxytocin (OT)-producing neurosecretory cells exhibit a low P(r) that is relatively uniform at multiple synapses onto the same cell. This low P(r) results from a two-step process that requires the tonic release of OT from the postsynaptic cell. The ambient extracellular levels of neuropeptide are sufficient to activate postsynaptic OT receptors and trigger the Ca2+-dependent production of endocannabinoids, which act in a retrograde manner at presynaptic cannabinoid CB1 receptors to decrease GABA release. The functional consequence of this tonic inhibition of GABA release is that all inhibitory inputs facilitate uniformly when activated at high rates of activity. This causes inhibition in the postsynaptic cell that is sufficiently powerful to disrupt firing. Blockade of CB1 receptors increases P(r) at these synapses, resulting in a rapid depression of IPSCs at high rates of activity, thereby eliminating the ability of afferent inputs to inhibit postsynaptic firing. By playing a deterministic role in GABA release at the afferent nerve terminal, the postsynaptic OT neuron effectively filters synaptic signals and thereby modulates its own activity patterns.
Figures


Similar articles
-
Postsynaptic origin of CB1-dependent tonic inhibition of GABA release at cholecystokinin-positive basket cell to pyramidal cell synapses in the CA1 region of the rat hippocampus.J Physiol. 2007 Jan 1;578(Pt 1):233-47. doi: 10.1113/jphysiol.2006.115691. Epub 2006 Oct 19. J Physiol. 2007. PMID: 17053036 Free PMC article.
-
Activity-dependent release and actions of endocannabinoids in the rat hypothalamic supraoptic nucleus.J Physiol. 2005 Dec 15;569(Pt 3):751-60. doi: 10.1113/jphysiol.2005.097477. Epub 2005 Oct 20. J Physiol. 2005. PMID: 16239276 Free PMC article.
-
Retrograde endocannabinoid signaling reduces GABAergic synaptic transmission to gonadotropin-releasing hormone neurons.Endocrinology. 2010 Dec;151(12):5818-29. doi: 10.1210/en.2010-0638. Epub 2010 Oct 6. Endocrinology. 2010. PMID: 20926585 Free PMC article.
-
Pre- and postsynaptic modulation of the electrical activity of rat supraoptic neurones.Exp Physiol. 2000 Mar;85 Spec No:145S-151S. doi: 10.1111/j.1469-445x.2000.tb00018.x. Exp Physiol. 2000. PMID: 10795917 Review.
-
Modulation of synaptic transmission by oxytocin and vasopressin in the supraoptic nucleus.Prog Brain Res. 2002;139:235-46. doi: 10.1016/s0079-6123(02)39020-4. Prog Brain Res. 2002. PMID: 12436939 Review.
Cited by
-
Integration of asynchronously released quanta prolongs the postsynaptic spike window.J Neurosci. 2007 Jun 20;27(25):6684-91. doi: 10.1523/JNEUROSCI.0934-07.2007. J Neurosci. 2007. PMID: 17581955 Free PMC article.
-
Cell signaling dependence of rapid glucocorticoid-induced endocannabinoid synthesis in hypothalamic neuroendocrine cells.Neurobiol Stress. 2019 Mar 21;10:100158. doi: 10.1016/j.ynstr.2019.100158. eCollection 2019 Feb. Neurobiol Stress. 2019. PMID: 31193551 Free PMC article.
-
Endocannabinoid Signaling in the Control of Social Behavior.Trends Neurosci. 2017 Jul;40(7):385-396. doi: 10.1016/j.tins.2017.04.005. Epub 2017 May 26. Trends Neurosci. 2017. PMID: 28554687 Free PMC article. Review.
-
Stress disrupts engram ensembles in lateral amygdala to generalize threat memory in mice.Cell. 2025 Jan 9;188(1):121-140.e20. doi: 10.1016/j.cell.2024.10.034. Epub 2024 Nov 15. Cell. 2025. PMID: 39549697
-
Serotonin evokes endocannabinoid release and retrogradely suppresses excitatory synapses.J Neurosci. 2008 Jun 18;28(25):6508-15. doi: 10.1523/JNEUROSCI.0678-08.2008. J Neurosci. 2008. PMID: 18562622 Free PMC article.
References
-
- Abbott LF, Regehr WG. Synaptic computation. Nature. 2004;431:796–803. - PubMed
-
- Abbott LF, Varela JA, Sen K, Nelson SB. Synaptic depression and cortical gain control. Science. 1997;275:220–224. - PubMed
-
- Bacci A, Huguenard JR, Prince DA. Long-lasting self-inhibition of neocortical interneurons mediated by endocannabinoids. Nature. 2004;431:312–316. - PubMed
Publication types
MeSH terms
Substances
LinkOut - more resources
Full Text Sources
Research Materials
Miscellaneous