. 2007 Feb 7;27(6):1346-55.
doi: 10.1523/JNEUROSCI.3822-06.2007.

A reevaluation of the inverse dynamic model for eye movements

Affiliations

A reevaluation of the inverse dynamic model for eye movements

Andrea M Green et al. J Neurosci. .

Abstract

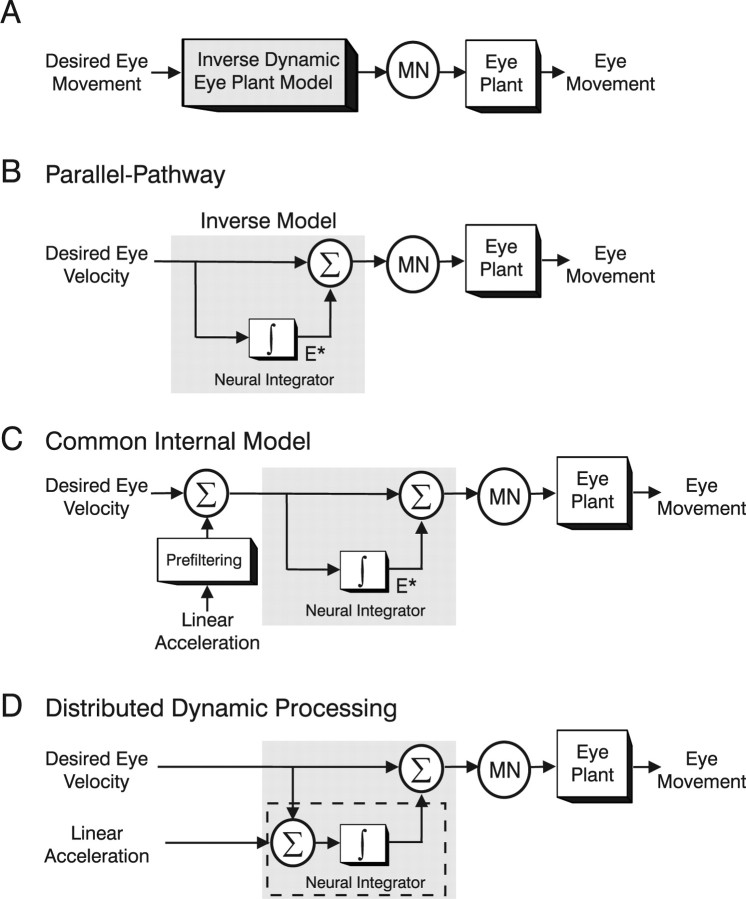
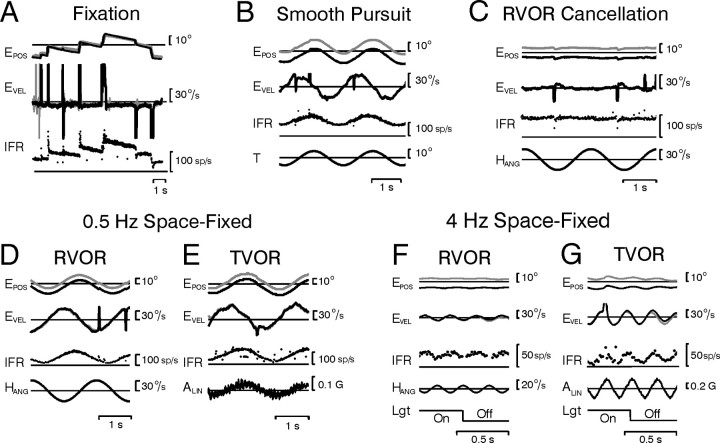
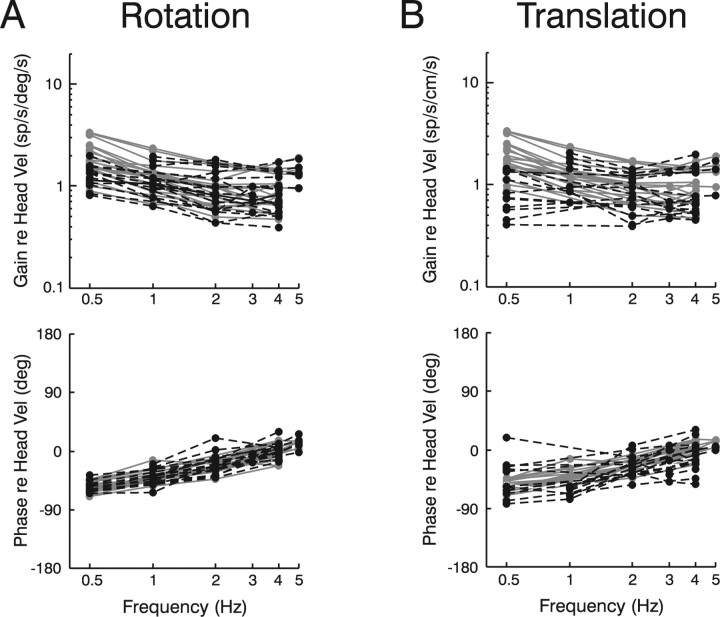
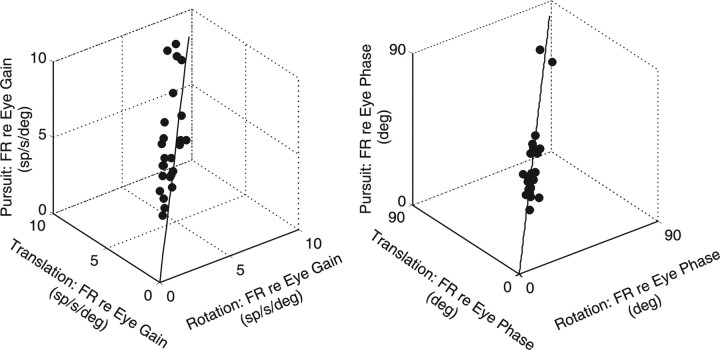
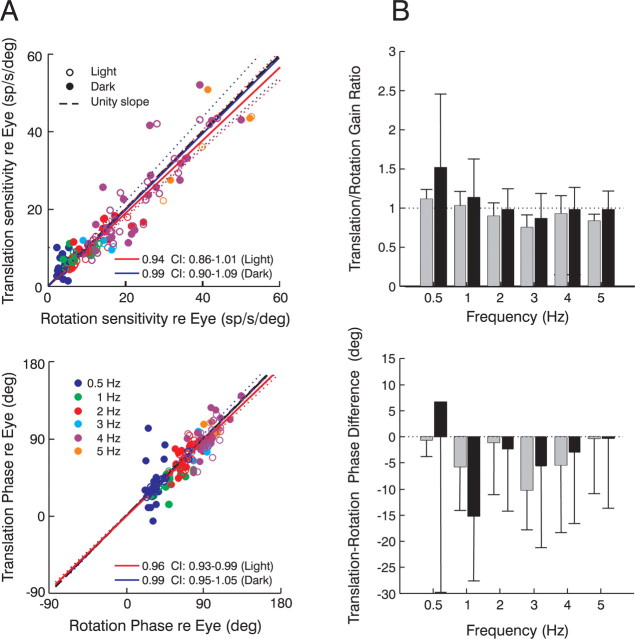
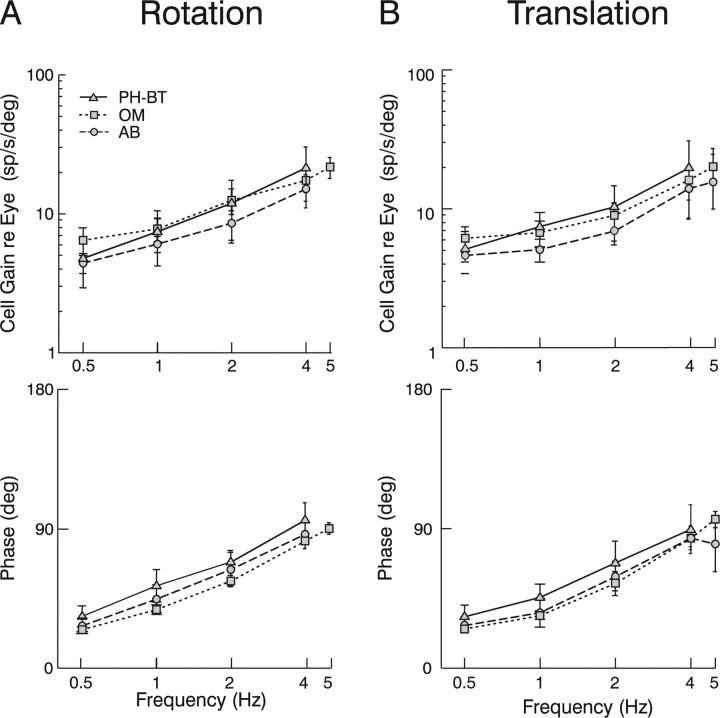
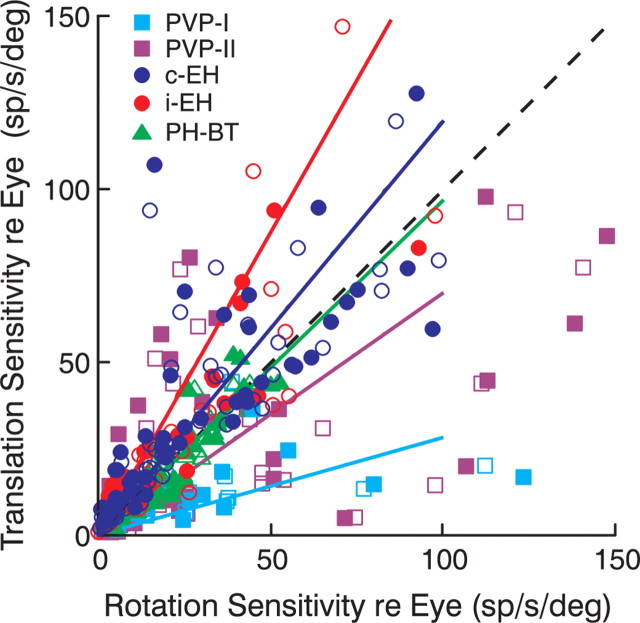
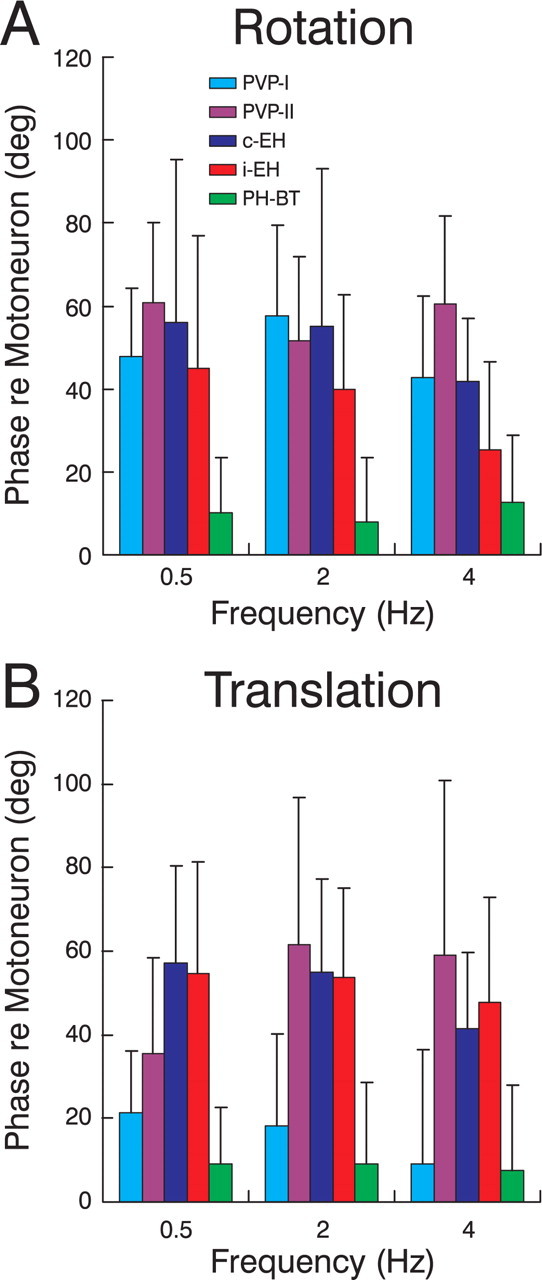
To construct an appropriate motor command from signals that provide a representation of desired action, the nervous system must take into account the dynamic characteristics of the motor plant to be controlled. In the oculomotor system, signals specifying desired eye velocity are thought to be transformed into motor commands by an inverse dynamic model of the eye plant that is shared for all types of eye movements and implemented by a weighted combination of eye velocity and position signals. Neurons in the prepositus hypoglossi and adjacent medial vestibular nuclei (PH-BT neurons) were traditionally thought to encode the "eye position" component of this inverse model. However, not only are PH-BT responses inconsistent with this theoretical role, but compensatory eye movement responses to translation do not show evidence for processing by a common inverse dynamic model. Prompted by these discrepancies between theoretical notions and experimental observations, we reevaluated these concepts using multiple-frequency rotational and translational head movements. Compatible with the notion of a common inverse model, we show that PH-BT responses are unique among all premotor cell types in bearing a consistent relationship to the motor output during eye movements driven by different sensory stimuli. However, because their responses are dynamically identical to those of motoneurons, PH-BT neurons do not simply represent an internal component of the inverse model, but rather its output. They encode and distribute an estimate of the motor command, a signal critical for accurate motor execution and learning.


Figures

Figure 1.
Figure 1.
Schematic illustration of hypotheses for the dynamic processing underlying eye movement generation. A, Desired eye velocity commands are processed by an inverse dynamic model of the eye plant before being conveyed onto extraocular MNs. B, Parallel-pathway implementation of the inverse dynamic model. The inverse model (gray shaded box) is constructed by summing a weighted combination of desired eye velocity (top) and integrated eye velocity signals (bottom). An internal estimate of desired eye position (E*) is presumed to exist at the output of the neural integrator (∫). C, Common internal model hypothesis for extending the framework to translation (TVOR). Otolith signals, encoding linear acceleration, are presumed to be “prefiltered” before converging on the inverse model used to convert desired eye velocity signals into appropriate motor commands (supplemental text, available at www.jneurosci.org as supplemental material). D, Distributed dynamic processing hypothesis for the TVOR. The internal model is not fully implemented in the TVOR pathways. Otolith signals are presumed to be processed by only the neural integrator portion (dashed box) of the inverse model that converts linear acceleration signals into velocity. To explain the high-pass nature of the TVOR, it is assumed that the dynamic characteristics of the eye plant remain uncompensated and therefore contribute to shaping the reflex at the higher frequencies where the TVOR exhibits a robust response (see supplemental text, available at www.jneurosci.org as supplemental material).
Figure 2.
Figure 2.
Horizontal burst-tonic cell recorded in the left prepositus hypoglossi. A–G, Responses during saccadic eye movements and fixations in darkness (A), smooth target tracking (B), rotation while stabilizing a head-fixed target (RVOR cancellation) (C), rotation (RVOR) or translation (TVOR) at a frequency of 0.5 Hz while stabilizing a space-fixed target (D, E), and rotation or translation at 4 Hz while stabilizing either a space-fixed target [Lgt (light) On] or a remembered target in darkness (Lgt Off) (F, G). EPOS, Eye position (right eye, gray; left eye, black); EVEL, eye velocity; T, target position; HANG, angular head velocity; ALIN, linear head acceleration; IFR, instantaneous firing rate; Lgt, lighting conditions (visual target on/off).
Figure 3.
Figure 3.
A, B, Frequency response characteristics of PH-BT cells during rotation (A) and translation (B). Response gains and phases are expressed relative to head velocity during either rotation or translation both in the presence (gray curves) and absence (dashed black curves) of visual feedback (i.e., light and dark conditions, respectively). The majority of cells (86%) responded to ipsilaterally directed eye or contralaterally directed head motion. Cell response phase has, thus, been expressed relative to contralaterally directed head velocity. Response phase in three cells that were excited for contralaterally directed eye or ipsilaterally directed head motion has been transposed by 180° to facilitate comparison with the dynamic characteristics of the other cells.
Figure 4.
Figure 4.
PH-BT responses during smooth pursuit, rotation, and translation (0.5 Hz). Gains (left) and phases (right) during smooth pursuit are compared with those during rotation or translation while stabilizing a space-fixed visual target. Gain refers to the neural firing rate modulation (FR, in spikes/second) relative to the evoked eye position (in degrees). Phase is expressed relative to the preferred eye movement direction of the cell. Solid traces indicate the unity-slope line.
Figure 5.
Figure 5.
PH-BT responses during rotation and translation (0.5–5 Hz). A, Neural response gains (top) and phases (bottom) relative to eye position during translation are compared with those during rotation. Data are plotted separately for different frequencies (blue, 0.5 Hz; green, 1 Hz; red, 2 Hz; cyan, 3 Hz; purple, 4 Hz; orange, 5 Hz) under either visual feedback (open circles) or dark (filled circles) conditions. Phases are expressed relative to the cell's preferred eye movement direction. B, Mean translation/rotation gain ratios (top) and translation-rotation phase differences (bottom) across frequencies under visual feedback conditions (gray bars) and in the dark (black bars). Error bars illustrate SD.
Figure 6.
Figure 6.
Comparison of the dynamic characteristics of PH-BT cells with those of extraocular motoneurons. A, B, Neural response gains (top) and phases (bottom) relative to eye position of PH-BT cells (triangles, solid lines) and motoneurons in the abducens (circles, dashed lines) and oculomotor (squares, dotted lines) nuclei during rotation (A) and translation (B) are plotted as a function of frequency. Phases are expressed relative to the preferred eye position direction of the cell. AB, Abducens neurons; OM, oculomotor neurons. Error bars illustrate SD.
Figure 7.
Figure 7.
Comparison of premotor cell responses during rotation and translation. Neural response gains relative to eye position across all frequencies during translation are compared with those during rotation under visual feedback (open symbols) and dark conditions (filled symbols). Different symbols and colors denote different cell types (cyan squares, PVP-I; purple squares, PVP-II; blue circles, c-EH; red circles, i-EH; green triangles, PH-BT). Solid lines indicate the regression slopes for data across all frequencies and lighting conditions (PVP-I: 0.28, 95% CI, 0.20–0.48; PVP-II: 0.70, 95% CI, 0.53–0.84; c-EH: 1.20, 95% CI, 1.06–1.39; i-EH: 1.75, 95% CI, 1.28–2.04; PH-BT: 0.97, 95% CI, 0.91–1.03). Dashed black line shows the unity slope.
Figure 8.
Figure 8.
Comparison of the dynamic characteristics of different premotor cell types with those of extraocular motoneurons. A, B, The difference between the response phase of each cell type and the average motoneural phase (i.e., mean of AB and OM cells) during rotation (A) and translation (B) is illustrated for frequencies of 0.5, 2, and 4 Hz (cyan, PVP-I; purple, PVP-II; blue, c-EH; red, i-EH; green, PH-BT). Positive values indicate a phase lead relative to the average motoneural phase. Error bars illustrate SD.
Figure 9.
Figure 9.
Schematic illustration of the dynamic processing for eye movement generation in which PH-BT cells represent the output of the inverse dynamic model. Although the PH-BT cell population is illustrated outside the box labeled “inverse model” for simplicity, these cells can also be considered to contribute as an integral part of the model through feedback interconnections (dotted line) with other premotor neural populations including PVP and EH neurons. PVP and EH cells, which may also participate in the inverse dynamic computations and are known to contribute to the motoneural command signal, are also shown projecting to the motoneuron population, MN. PH-BT cells are postulated to distribute an estimate of the motor command signal to other brain areas (e.g., the cerebellar flocculus) that potentially implement a forward model of the eye plant. The estimated motor response at the output of such a forward model can be compared with the desired eye movement to help refine the motor command signal.

Similar articles

Cited by

References

    1. Angelaki DE. Three-dimensional organization of otolith-ocular reflexes in rhesus monkeys. III. Responses to translation. J Neurophysiol. 1998;80:680–695. - PubMed
    1. Angelaki DE, McHenry MQ, Hess BJ. Primate translational vestibulo-ocular reflexes. I. High-frequency dynamics and three-dimensional properties during lateral motion. J Neurophysiol. 2000;83:1637–1647. - PubMed
    1. Angelaki DE, Green AM, Dickman JD. Differential sensorimotor processing of vestibulo-ocular signals during rotation and translation. J Neurosci. 2001;21:3968–3985. - PMC - PubMed
    1. Arnold DB, Robinson DA. A learning network model of the neural integrator of the oculomotor system. Biol Cybern. 1991;64:447–454. - PubMed
    1. Arnold DB, Robinson DA. The oculomotor integrator: testing of a neural network model. Exp Brain Res. 1997;113:57–74. - PubMed

Publication types

LinkOut - more resources