Gender-specific left-right asymmetries in human visual cortex
- PMID: 17287510
- PMCID: PMC6673571
- DOI: 10.1523/JNEUROSCI.4753-06.2007
Gender-specific left-right asymmetries in human visual cortex
Abstract
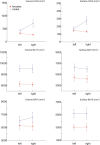
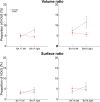
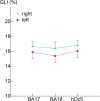
The structural correlates of gender differences in visuospatial processing are essentially unknown. Our quantitative analysis of the cytoarchitecture of the human primary visual cortex [V1/Brodmann area 17 (BA17)], neighboring area V2 (BA18), and the cytoarchitectonic correlate of the motion-sensitive complex (V5/MT+/hOc5) shows that the visual areas are sexually dimorphic and that the type of dimorphism differs among the areas. Gender differences exist in the interhemispheric asymmetry of hOc5 volumes and in the right-hemispheric volumetric ratio of hOc5 to BA17, an area that projects to V5/MT+/hOc5. Asymmetry was also observed in the surface area of hOc5 but not in its cortical thickness. The differences give males potentially more space in which to process additional information, a finding consistent with superior male processing in particular visuospatial tasks, such as mental rotation. Gender differences in hOc5 exist with similar volume fractions of cell bodies, implying that, overall, the visual neural circuitry is similar in males and females.
Figures


Similar articles
-
Human V5/MT+: comparison of functional and cytoarchitectonic data.Anat Embryol (Berl). 2005 Dec;210(5-6):485-95. doi: 10.1007/s00429-005-0064-y. Anat Embryol (Berl). 2005. PMID: 16328357
-
Cytoarchitectonic analysis of the human extrastriate cortex in the region of V5/MT+: a probabilistic, stereotaxic map of area hOc5.Cereb Cortex. 2007 Mar;17(3):562-74. doi: 10.1093/cercor/bhj181. Epub 2006 Apr 7. Cereb Cortex. 2007. PMID: 16603710
-
Direction-dependent visual cortex activation during horizontal optokinetic stimulation (fMRI study).Hum Brain Mapp. 2006 Apr;27(4):296-305. doi: 10.1002/hbm.20185. Hum Brain Mapp. 2006. PMID: 16080162 Free PMC article.
-
Structure and function of visual area MT.Annu Rev Neurosci. 2005;28:157-89. doi: 10.1146/annurev.neuro.26.041002.131052. Annu Rev Neurosci. 2005. PMID: 16022593 Review.
-
Human cortical areas underlying the perception of optic flow: brain imaging studies.Int Rev Neurobiol. 2000;44:269-92. doi: 10.1016/s0074-7742(08)60746-1. Int Rev Neurobiol. 2000. PMID: 10605650 Review.
Cited by
-
A pediatric structural MRI analysis of healthy brain development from newborns to young adults.Hum Brain Mapp. 2017 Dec;38(12):5931-5942. doi: 10.1002/hbm.23799. Epub 2017 Sep 12. Hum Brain Mapp. 2017. PMID: 28898497 Free PMC article.
-
Sex differences in parietal lobe morphology: relationship to mental rotation performance.Brain Cogn. 2009 Apr;69(3):451-9. doi: 10.1016/j.bandc.2008.09.004. Epub 2008 Nov 5. Brain Cogn. 2009. PMID: 18980790 Free PMC article.
-
Sex-related variation in human behavior and the brain.Trends Cogn Sci. 2010 Oct;14(10):448-56. doi: 10.1016/j.tics.2010.07.005. Epub 2010 Aug 18. Trends Cogn Sci. 2010. PMID: 20724210 Free PMC article. Review.
-
Cytoarchitectonic Maps of the Human Metathalamus in 3D Space.Front Neuroanat. 2022 Mar 8;16:837485. doi: 10.3389/fnana.2022.837485. eCollection 2022. Front Neuroanat. 2022. PMID: 35350721 Free PMC article.
-
Cytoarchitectonic parcellation and functional characterization of four new areas in the caudal parahippocampal cortex.Brain Struct Funct. 2022 May;227(4):1439-1455. doi: 10.1007/s00429-021-02441-2. Epub 2022 Jan 6. Brain Struct Funct. 2022. PMID: 34989871 Free PMC article.
References
-
- Aboitiz F, Scheibel AB, Fisher RS, Zaidel E. Fiber composition of the human corpus callosum. Brain Res. 1992;598:143–153. - PubMed
-
- Amunts K, Schlaug G, Schleicher A, Steinmetz H, Dabringhaus A, Roland PE, Zilles K. Asymmetry in the human motor cortex and handedness. NeuroImage. 1996;4:216–222. - PubMed
-
- Amunts K, Malikovic A, Mohlberg H, Schormann T, Zilles K. Brodmann's areas 17 and 18 brought into stereotaxic space: where and how variable? NeuroImage. 2000;11:66–84. - PubMed
-
- Amunts K, Kedo O, Kindler M, Pieperhoff P, Schneider F, Mohlberg H, Habel U, Shah JN, Zilles K. Cytoarchitectonic mapping of the human amygdala, hippocampal region and entorhinal cortex. Anat Embryol. 2005;210:343–352. - PubMed
-
- Andreassi JL, Juszczak NM. Hemispheric sex differences in response to moving stimuli as indicated by visual evoked potentials. Int J Neurosci. 1982;17:83–91. - PubMed
Publication types
MeSH terms
LinkOut - more resources
Full Text Sources
