Comparative Study
. 2007 Feb 7;27(6):1386-95.
doi: 10.1523/JNEUROSCI.4714-06.2007.

Primed vesicles can be distinguished from docked vesicles by analyzing their mobility

Affiliations
Comparative Study

Primed vesicles can be distinguished from docked vesicles by analyzing their mobility

Shahira Nofal et al. J Neurosci. .

Abstract

Neurotransmitters are released from nerve terminals and neuroendocrine cells by calcium-dependent exocytosis of vesicles. Before fusion, vesicles are docked to the plasma membrane and rendered release competent through a process called priming. Electrophysiological methods such as membrane capacitance measurements and carbon fiber amperometry accurately measure the fusion step of exocytosis with high time resolution but provide only indirect information about priming and docking. Total internal reflection fluorescence microscopy (TIRFM) enables the real-time visualization of vesicles, near the plasma membrane, as they undergo changes from one molecular state to the other. We devised a new method to analyze the mobility of vesicles, which not only allowed us to classify the movement of vesicles in three different categories but also to monitor dynamic changes in the mobility of vesicles over time. We selectively enhanced priming by treating bovine chromaffin cells with phorbol myristate acetate (PMA) or by overexpressing Munc13-1 (mammalian Unc) and analyzed the mobility of large dense-core vesicles. We demonstrate that nearly immobile vesicles represent primed vesicles because the pool of vesicles displaying this type of mobility was significantly increased after PMA treatment and Munc13-1 overexpression and decreased during tetanus toxin expression. Moreover, we showed that the movement of docked but unprimed vesicles is restricted to a confined region of approximately 220 nm diameter. Finally, a small third population of undocked vesicles showed a directed and probably active type of mobility. For the first time, we can thus distinguish the molecular state of vesicles in TIRFM by their mobility.


Figures
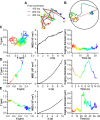
Figure 1.
Figure 1.
The CD accurately describes the movement of all vesicles. A, The MSD is obtained by averaging the square distances between positions occupied by the vesicle (circles) in a time increment Δt. The blue, red, and black lines represent the distance during a time increment of 100, 200, and 300 ms, respectively. Analysis starts at position “1” and ends at position “17.” B, A new method of analysis allows us to determine the CD, which is the maximal distance reached by the vesicle within a time frame of 6 s. The analysis starts and ends at the red and blue circles, respectively. The red dashed line represents the maximal distance reached. C–E, Analysis of three exemplary vesicles with distinct types of motion. The left corresponds to the trajectories of the vesicles throughout their lifetimes (recording frequency was 10 Hz). The middle represents the MSD versus Δt and the right the CD over time of the vesicle shown on the left. Note that the MSD correctly interprets the motion of the vesicle in C and D but not in E. Note the scaling difference between C (<1 μm in left and right) and D and E (>1 μm).
Figure 2.
Figure 2.
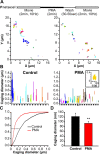
PMA treatment decreased the mobility of vesicles. A, Top, Scheme of the protocol used in this experiment. Bottom, Trajectories of the vesicles in an exemplary cell before (control) and after PMA treatment. B, CD over time of the tracks of the vesicles shown in A; inset represents the CD of one vesicle over the 2 min of recording. C, Normalized cumulative histogram of CD of vesicles of the cell shown in A. Note the leftward shift after PMA treatment. D, PMA treatment significantly decreases the 50% value of the normalized cumulative histogram (dotted line in C). Results represent the mean from 21 cells (878 vesicles). Error bars represent SEM. **p < 0.01.
Figure 3.
Figure 3.
Classification of vesicle mobility. A, Normalized distribution of CDs of fixed beads. • represents the measured values, and the Gaussian fit is shown as solid line. B, Normalized distribution of CDs of vesicles that fused with the plasma membrane, N = 9, n = 10 (analysis was limited to 15 s before fusion). The dashed lines illustrate the four individual peaks of the Gaussian fit. C, Normalized distribution of CDs of vesicles that did not fuse; N = 13, n = 14. Note that the integral of the second Gaussian is more prominent than the integral of the third Gaussian during priming (B).
Figure 4.
Figure 4.
PMA treatment significantly increases the number of immobile vesicles. A, Proposed model illustrating the different pools of vesicles corresponding to distinct molecular states: primed pool, docked pool, and depot pool. We classified the vesicles into nearly immobile vesicles (I) representing the primed pool, caged vesicles (C) representing the docked pool, and vesicles having a directed motion (D) belonging to the depot pool. Immobile-caged (IC) and mixed (M) were vesicles that underwent changes between the three molecular states. EW, Evanescent wave. B, Fraction of vesicles in each type of motion. C, Time spent in each type of motion; N = 21, n = 878. Note the significant increase in the number of immobile vesicles after PMA treatment and the corresponding increase in the time spent in the immobile state. Error bars represent SEM; *p < 0.05; **p < 0.01; ***p < 0.005.
Figure 5.
Figure 5.
Co-overexpression of Munc13-1 and NPY yields a similar increase in secretion as overexpression of Munc13-1 alone using membrane capacitance and TIRFM measurements. A, Capacitance recordings showing increased secretion in Munc13-1-overexpressing cells compared with control cells. B, Distribution of secretion events elicited by 90 mm KCl application over time detected using TIRFM. The bin size was 2 s long. Munc13-1-overexpressing cells are represented in black and control cells in white. Note that most secretion events in Munc13-1-overexpressing cells (n = 33) occurred in the first 10 s of depolarization, whereas in control cells (n = 28) the events were evenly distributed over the entire 20 s of depolarization. During this time period, the secretion of Munc13-1-overexpressing cells was approximately three times higher than in control cells.
Figure 6.
Figure 6.
Vesicles of Munc13-1-overexpressing cells display lower mobility than in control cells. A, Normalized cumulative histogram of CD in control (dotted line) and in Munc13-1-overexpressing cells (solid line). The latter was significantly shifted to the left (p = 0.05; N = 24 and 31 for control and Munc13-1, respectively). B, Fraction of vesicles in each type of motion. C, Fraction of time the LDCVs spent in each type of motion. Control, N = 24, n = 686; Munc13-1, N = 31, n = 695. Error bars represent SEM. **p < 0.01; ***p < 0.005. I, Immobile vesicles; C, caged vesicles; IC, immobile-caged vesicles; D, vesicles having a directed motion; M, mixed vesicles.
Figure 7.
Figure 7.
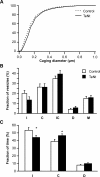
Vesicles of tetanus toxin-expressing cells show an increased mobility compared with vesicles in control cells. A, Normalized cumulative histogram of CD showed a right shift in TeNt-expressing cells compared with control. The CD at 50% of the normalized cumulative histogram was significantly increased from 131.64 ± 7.94 nm in control cells to 153.14 ± 7.64 nm in cells expressing TeNt (n = 453; p = 0.03). B, Fraction of vesicles in each type of motion. C, Fraction of time the LDCVs spent in each type of motion. Control, N = 25, n = 553; TeNt, N = 22, n = 453. Error bars represent SEM. *p < 0.05. I, Immobile vesicles; C, caged vesicles; IC, immobile-caged vesicles; D, vesicles having a directed motion; M, mixed vesicles.

References

    1. Allersma MW, Bittner MA, Axelrod D, Holz RW. Motion matters: secretory granule motion adjacent to the plasma membrane and exocytosis. Mol Biol Cell. 2006;17:2424–2438. - PMC - PubMed
    1. Ashery U, Betz A, Xu T, Brose N, Rettig J. An efficient method for infection of adrenal chromaffin cells using the Semliki Forest virus gene expression system. Eur J Cell Biol. 1999;78:525–532. - PubMed
    1. Ashery U, Varoqueaux F, Voets T, Betz A, Thakur P, Koch H, Neher E, Brose N, Rettig J. Munc13-1 acts as a priming factor for large dense-core vesicles in bovine chromaffin cells. EMBO J. 2000;19:3586–3596. - PMC - PubMed
    1. Becherer U, Rettig J. Vesicle pools, docking, priming and release. Cell Tiss Res. 2006;326:393–407. - PubMed
    1. Borisovska M, Zhao Y, Tsytsyura Y, Glyvuk N, Takamori S, Matti U, Rettig J, Südhof T, Bruns D. v-SNAREs control exocytosis of vesicles from priming to fusion. EMBO J. 2005;24:2114–2126. - PMC - PubMed

Publication types

MeSH terms

LinkOut - more resources