Comparative Study
. 2007 Feb 7;27(6):1445-55.
doi: 10.1523/JNEUROSCI.4694-06.2007.

Roles of volume-sensitive chloride channel in excitotoxic neuronal injury

Affiliations
Comparative Study

Roles of volume-sensitive chloride channel in excitotoxic neuronal injury

Hana Inoue et al. J Neurosci. .

Abstract

Excitotoxicity is associated with stroke, brain trauma, and a number of neurodegenerative disorders. In the brain, during excitotoxic insults, neurons undergo rapid swelling in both the soma and dendrites. Focal swellings along the dendrites called varicosities are considered to be a hallmark of acute excitotoxic neuronal injury. However, it is not clear what pathway is involved in the neuronal anion flux that leads to the formation and resolution of excitotoxic varicosities. Here, we assessed the roles of the volume-sensitive outwardly rectifying (VSOR) Cl- channel in excitotoxic responses in mouse cortical neurons. Whole-cell patch-clamp recordings revealed that the VSOR Cl- channel in cultured neurons was activated by NMDA exposure. Moreover, robust expression of this channel on varicosities was confirmed by on-cell and nystatin-perforated vesicle patch techniques. VSOR channel blockers, but not blockers of GABA(A) receptors and Cl- transporters, abolished not only varicosity resolution after sublethal excitotoxic stimulation but also necrotic death after sustained varicosity formation induced by prolonged NMDA exposure in cortical neurons. The present slice-patch experiments demonstrated, for the first time, expression of the VSOR Cl- channels in somatosensory pyramidal neurons. NMDA-induced necrotic neuronal death in slice preparations was largely suppressed by a blocker of the VSOR Cl- channel but not of the GABA(A) receptor. These results indicate that VSOR Cl- channels exert dual, reciprocal actions on neuronal excitotoxicity by serving as major anionic pathways both for varicosity recovery after washout of an excitotoxic stimulant and for persistent varicosity formation under prolonged excitotoxic insults leading to necrosis in cortical neurons.


Figures

Figure 1.
Figure 1.
Varicosity formation and necrotic cell death induced by NMDA receptor activation in cultured mouse cortical neurons. A, Images of an EGFP-expressing neuron before (top) and 10 min after (middle) exposure to NMDA as well as 60 min after NMDA removal (bottom). Scale bar, 30 μm. B, Time course of varicosity formation after exposure to NMDA. Cultures were exposed to 30 μm NMDA and fixed at each time point (0, 10, 20, 60, 120 min). The number of EGFP-expressing or DiI-labeled neurons displaying varicosities, as a percentage of the total number of counted neurons, is represented on the y-axis. Each symbol represents the mean ± SEM (error bars). C, Time course of NMDA-induced LDH release. Neuronal death was assessed by LDH release 10, 20, 60, 120, and 180 min after exposure to 30 μm NMDA. Each column represents the mean ± SEM (error bars).
Figure 2.
Figure 2.
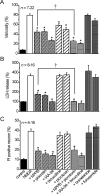
Effects of blockers of Cl channels or transporters on varicosity formation and necrotic cell death induced by NMDA exposure in cultured mouse cortical neurons. A–C, Varicosity formation (A), LDH release (B), and PI uptake (C) were assessed 20 min, 3 h, and 3 h, respectively, after application of 30 μm NMDA in the absence and presence of VSOR Cl channel blockers (NPPB 40 μm, phloretin 100 μm, IAA-94 1 mm), GABAA receptor blockers (bicuculline 10 μm, picrotoxin 100 μm), and Cl cotransporter blockers (bumetanide 10 μm, furosemide 1 mm). On the varicosity formation (A), there was no statistically significant difference between the effect of NPPB or phloretin and that of bicuculline or picrotoxin, whereas the inhibiting effect of IAA-94 was significantly stronger than that of bicuculline or picrotoxin. On the NMDA-induced neuronal cell death (B, C), the effect of each of three Cl channel blockers was significantly different from that of either GABAA receptor blocker. *p < 0.05 versus NMDA exposure in the absence of drugs. p < 0.05 between NMDA exposure in the presence of 40 μm NPPB and that in the combined presence of 40 μm NPPB and 100 μm picrotoxin. Each symbol represents the mean ± SEM (error bars).
Figure 3.
Figure 3.
Varicosity resolution after removal of NMDA and its sensitivity to blockers of Cl channels or transporters in cultured mouse cortical neurons. A, Time course of recovery from varicosities after termination of sublethal exposure to NMDA (30 μm for 10 min). B, Effects of VSOR Cl channel blockers (NPPB 40 μm, phloretin 100 μm, IAA-94 1 mm), GABAA receptor blockers (bicuculline 10 μm, picrotoxin 100 μm), and Cl cotransporter blockers (bumetanide 10 μm, furosemide 1 mm) on recovery from varicosities after removal of NMDA (30 μm for 10 min). *p < 0.05 versus 0 min. p < 0.05 versus control. Each symbol or column represents the mean ± SEM (error bars).
Figure 4.
Figure 4.
Whole-cell Cl currents activated after NMDA exposure in cultured mouse cortical neurons. A, Representative trace showing Cl current activation after sublethal stimulation with NMDA (30 μm for 10 min). Alternating pulses (2 s duration, every 15 s) or step pulses from −100 to +40 mV in 20 mV increments (at arrows) were applied to elicit currents in the absence of NMDA; during NMDA exposure, the membrane potential was held at −40 mV. Arrowhead represents the zero-current level. Insets, Fluorescence micrographs captured before (left) and after (right) exposure to NMDA. Calcein (5 μm) was introduced via the pipette solution. Scale bar, 30 μm. B, Expanded traces of current responses to step pulses from −100 to +40 mV (left and middle traces) or +120 mV (right traces) in 20 mV increments. Inactivation could be seen at large positive potentials (more than or equal to +80 mV). C, Current–voltage relationships of Cl currents recorded before (squares) and after (circles) exposure to NMDA. *At given voltages, data points designated with circles that were significantly different from those designated with squares at p < 0.05. Each symbol represents the mean ± SEM (error bars).
Figure 5.
Figure 5.
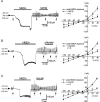
A–C, Effects of 80 μm NPPB (A), 100 μm phloretin (B), and 1 mm IAA-94 (C) on Cl currents activated after NMDA exposure in cultured mouse cortical neurons. Left, Representative current records before, during, and after sublethal stimulation with NMDA (30 μm for 10 min) in the absence and presence of NPPB, phloretin, or IAA-94 added to the bathing solution. Alternating pulses (2 s duration, every 15 s) or step pulses from −100 to +40 mV in 20 mV increments (at arrows) were applied to record currents in the absence of NMDA; during NMDA exposure, the membrane potential was held at −40 mV. Arrowheads represent the zero-current level. Right, Current–voltage relationships in the absence (squares) and presence (circles) of NPPB, phloretin, or IAA-94. Each symbol represents the mean current ± SEM (error bars). *At given voltages, data points designated with circles that were significantly different from those designated with squares at p < 0.05.
Figure 6.
Figure 6.
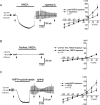
Dependence of Cl currents activated after glutamate receptor stimulation on swelling and Na+ influx in cultured mouse cortical neurons. A, Effects of osmotic shrinkage induced by hypertonic solution (400 mOsm) on Cl currents activated after sublethal stimulation with NMDA (30 μm for 10 min). B, Effects of Na+ removal during NMDA exposure on activation of Cl currents after NMDA exposure. C, Effects of stimulation with AMPA (1 μm) plus cyclothiazide (2.5 μm) for 10 min on activation of Cl currents. Left, Representative records of currents before, during, and after stimulation with NMDA or AMPA, and sensitivity to NPPB and hypertonicity. Alternating pulses (2 s duration, every 15 s) or step pulses from −100 to +40 mV in 20 mV increments (at arrows) were applied to record currents in the absence of NMDA or AMPA; during exposure to NMDA or AMPA, the membrane potential was held at −40 mV. Arrowheads represent the zero-current level. Right, Current–voltage relationships of NMDA-activated currents recorded under isotonic (squares) and hypertonic (circles) conditions (A), of currents recorded before (squares) and after (circles) exposure to Na+-free, low-Mg2+ solution containing 30 μm NMDA (B), or of AMPA-activated currents in the absence (squares) and presence (circles) of 80 μm NPPB (C). Each symbol represents the mean current ± SEM (error bars). *At given voltages, data points designated with circles that were significantly different from those designated with squares at p < 0.05.
Figure 7.
Figure 7.
Single-channel recordings from varicosities induced by NMDA exposure in cultured mouse cortical neurons. A, Unitary current records from on-varicosity patches. Top, Micrograph of the on-cell configuration formed on a varicosity in an EGFP-expressing neuron after NMDA exposure. Middle, Representative traces of single-channel currents recorded from a varicosity during NMDA exposure. Varying step pulses (−Vp) were applied from a holding potential of −40 mV at the onset of the traces. Arrowheads represent the zero-current level. Bottom, Current–voltage relationship for single-channel events recorded from on-varicosity patches. B, Unitary current records from perforated-vesicle outside-out patches excised from varicosities. After perforation (monitored by series resistance), the pipette was lifted up to make the perforated-vesicle patch configuration. Top, Representative traces of single-channel currents at their onset, elicited with application of a voltage step from a holding potential of 0 to +140 mV. An 80 μm concentration of NPPB reversibly inhibited single-channel currents. Arrowheads represent the zero-current level. Bottom, Current–voltage relationship for single-channel events recorded from perforated-vesicle outside-out varicosity patches. Each symbol represents the mean unitary current (i) ± SEM (error bars).
Figure 8.
Figure 8.
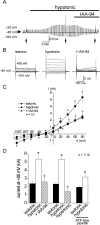
Whole-cell Cl currents activated by hypotonic stress in mouse layer V neurons in slices of the barrel cortex. A, Representative trace showing current activation after hypotonic stress. Alternating pulses (2 s duration, every 15 s) or step pulses from −100 to +80 mV in 20 mV increments (at arrows) were applied to elicit currents. B, Expanded traces of current responses to step pulses (arrows in A) under isotonic (left) or hypotonic conditions in the absence (middle) or presence (right) of IAA-94 (1 mm). Inactivation kinetics could be seen at +80 mV in currents activated by hypotonic stress in the absence of IAA-94. C, Current–voltage relationships under the isotonic (squares) or hypotonic conditions in the absence (circles) or presence (triangles) of IAA-94. D, The effects of IAA-94 (1 mm), hypertonicity (400 mOsm) or intracellular ATP removal on current activation induced by hypotonic stress at +80 mV. *p < 0.05 versus isotonic. p < 0.05 versus hypotonic. Each symbol or column represents the mean ± SEM (error bars).
Figure 9.
Figure 9.
Necrotic cell death induced by NMDA receptor activation and its sensitivity to Cl channel blockers in brain slices. A, Representative PI staining of slices taken 1 h after incubation in control or NMDA-containing ACSF with or without IAA-94 (1 mm). A representative bright-field image of a brain slice used in the present study is shown in the top left (control). Clear column structures can be seen in layer IV. PI signal increased in the slice treated with 30 μm NMDA. Application of IAA-94 decreased NMDA-induced cell death. Scale bar, 500 μm. B, Normalized PI signals in the brain slices. NMDA (30 μm) increased neuronal injury. IAA-94 (1 mm) but not bicuculline (10 μm) reduced cell injury induced by application of 30 μm NMDA. *p < 0.05 versus NMDA. p < 0.05 versus control. Each column represents the mean ± SEM (error bars).
Figure 10.
Figure 10.
Schematic illustration of dual roles of the VSOR Cl channel in mouse cortical neurons under excitotoxic conditions. The VSOR Cl channel is activated during excitotoxic glutamate stimulation and leads to formation of varicosities (process 1), and later to NVI (process 2) and necrotic cell death (process 3), by inducing NaCl influx in cooperation with GluR cation channels in both process 1 and 2, as well as with GABAAR anion channels in process 1. The VSOR Cl channel is also activated after washout of glutamate and leads to resolution of varicosities (process 4) by inducing KCl efflux in cooperation presumably with K+ channels. GluR-mediated Ca2+ influx, which is known to be another key element of glutamate toxicity, is not included in this scheme.

Similar articles

Cited by

References

    1. Azouz R, Alroy G, Yaari Y. Modulation of endogenous firing patterns by osmolarity in rat hippocampal neurones. J Physiol (Lond) 1997;502:175–187. - PMC - PubMed
    1. Babot Z, Cristófol R, Suñol C. Excitotoxic death induced by released glutamate in depolarized primary cultures of mouse cerebellar granule cells is dependent on GABAA receptors and niflumic acid-sensitive chloride channels. Eur J Neurosci. 2005;21:103–112. - PubMed
    1. Barros LF, Hermosilla T, Castro J. Necrotic volume increase and the early physiology of necrosis. Comp Biochem Physiol A Mol Integr Physiol. 2001;130:401–409. - PubMed
    1. Chebabo SR, Hester MA, Aitken PG, Somjen GG. Hypotonic exposure enhances synaptic transmission and triggers spreading depression in rat hippocampal tissue slices. Brain Res. 1995;695:203–216. - PubMed
    1. Chen Q, Moulder K, Tenkova T, Hardy K, Olney JW, Romano C. Excitotoxic cell death dependent on inhibitory receptor activation. Exp Neurol. 1999;160:215–225. - PubMed

Publication types

MeSH terms

Substances

LinkOut - more resources