. 2007 Feb 7;27(6):1498-506.
doi: 10.1523/JNEUROSCI.4806-06.2007.

Hypo-osmolar stress induces p75NTR expression by activating Sp1-dependent transcription

Affiliations

Hypo-osmolar stress induces p75NTR expression by activating Sp1-dependent transcription

Alberto Ramos et al. J Neurosci. .

Abstract

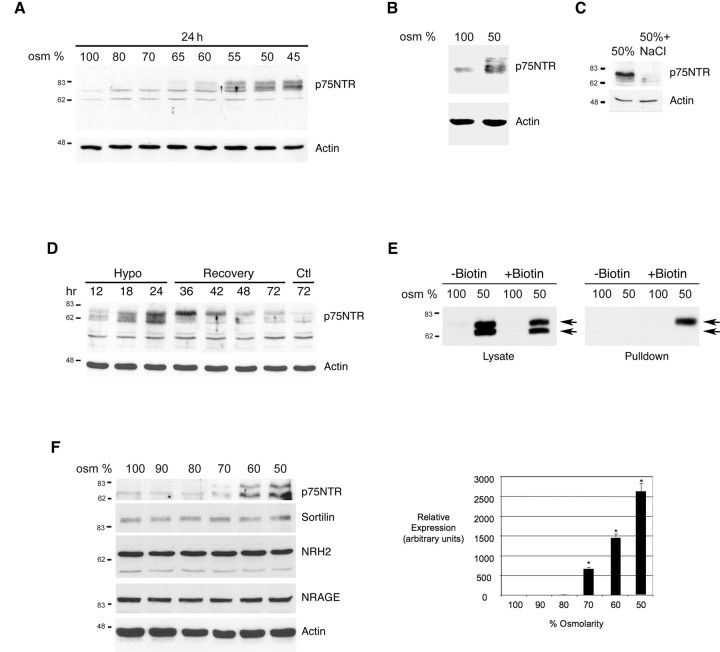
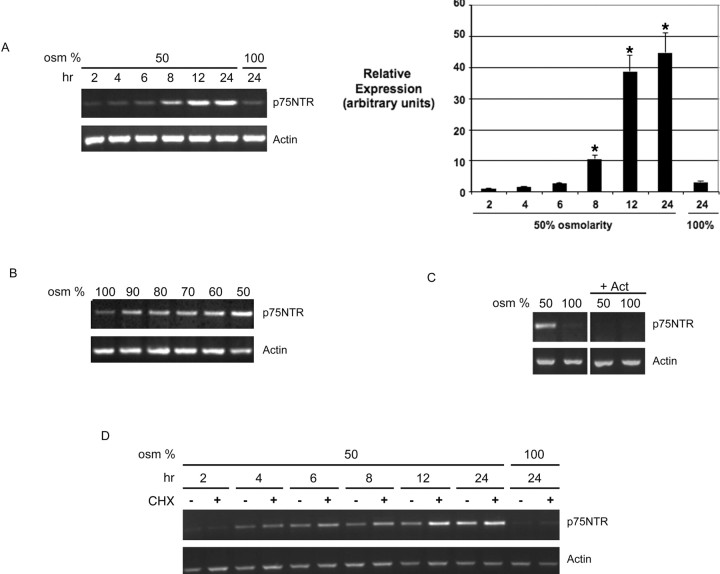
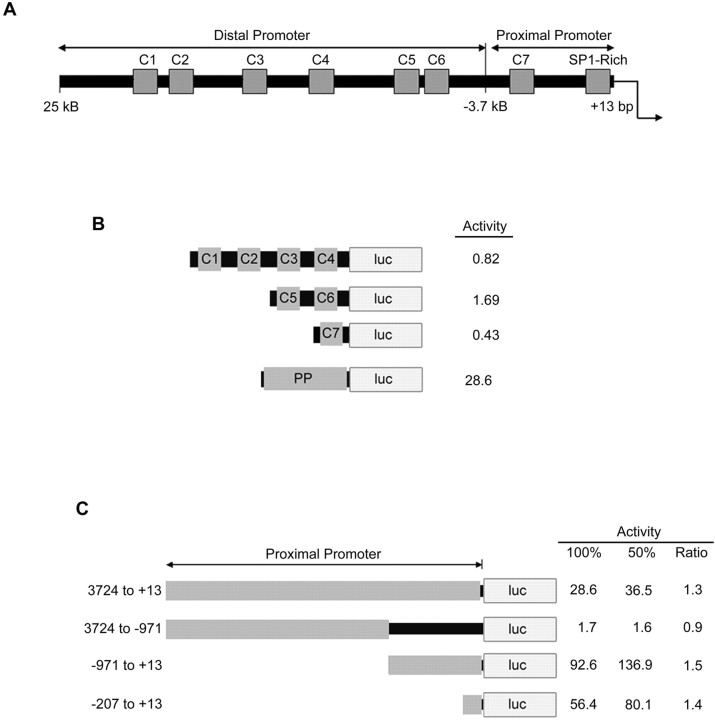
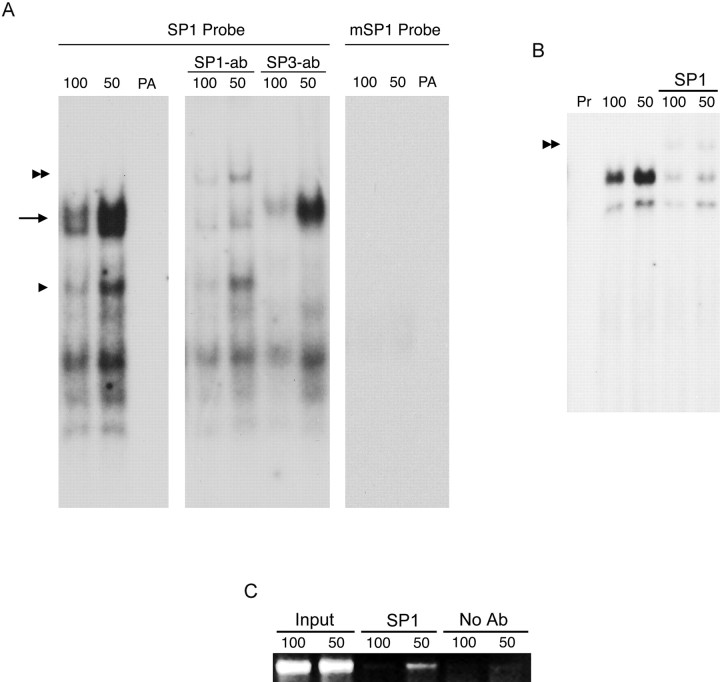
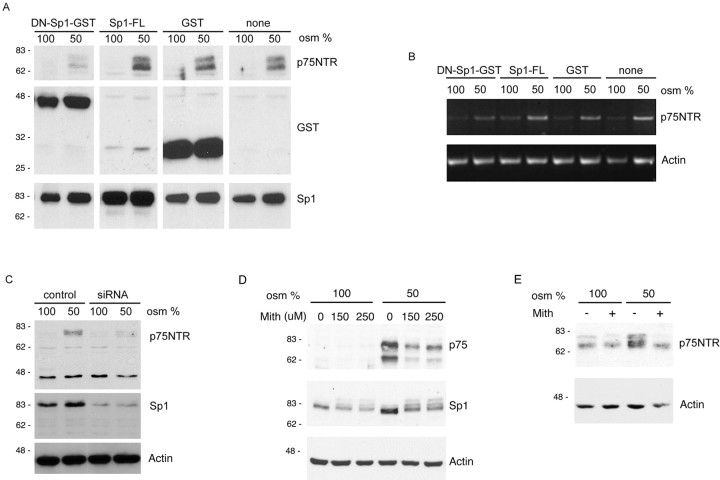
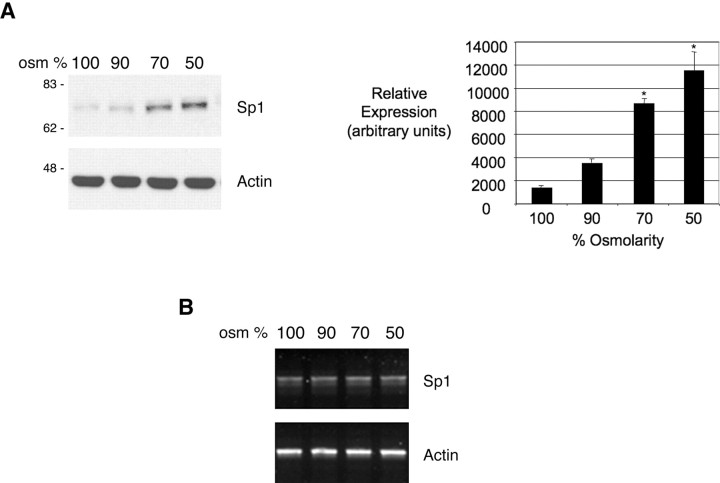
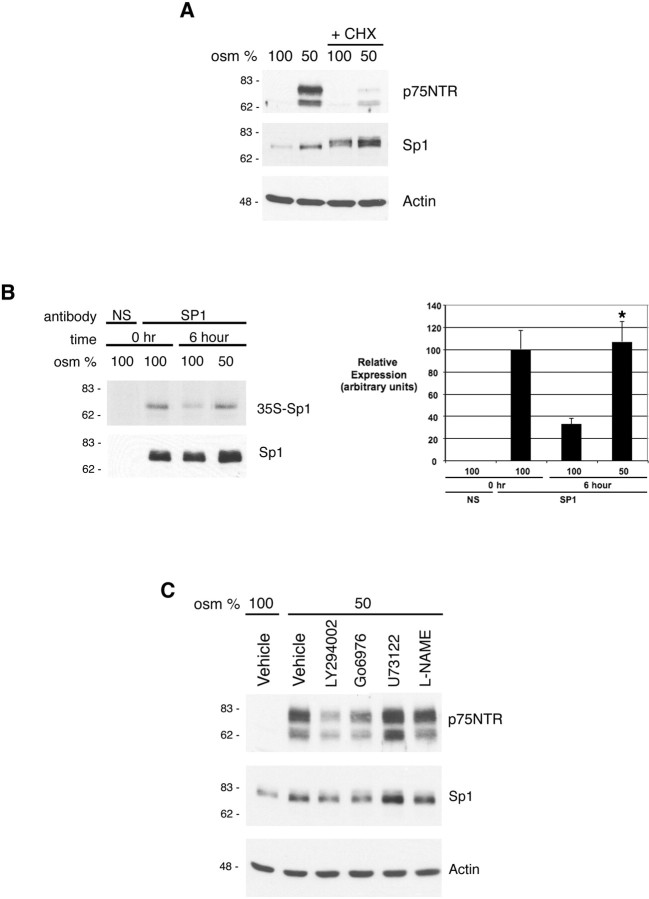
Injury-induced expression of the p75 neurotrophin receptor (p75NTR) in the CNS facilitates neuronal apoptosis and prevents neuronal regrowth, but the mechanisms regulating p75NTR expression are poorly characterized. In this study, we showed that hypo-osmolarity induces p75NTR expression in primary neurons, and, using a comparative genomics approach, we identified conserved elements in the 25 kb upstream sequences of the rat, mouse, and human p75NTR genes. We found that only one of these, a proximal region rich in Sp1 sites, responds to changes in hypo-osmolarity. We then showed that Sp1 DNA binding activity is increased in cells exposed to hypo-osmolarity, established that hypo-osmolarity enhanced Sp1 binding to the endogenous p75NTR promoter, and showed that Sp1 is required for p75NTR expression induced by hypo-osmolarity. We examined how Sp1 is regulated to effect these changes and established that Sp1 turnover is strongly inhibited by hypo-osmolarity. We propose that stress-induced Sp1 accumulation that results from reductions in Sp1 turnover rate contributes to injury-induced gene expression.


Figures

Figure 1.
Figure 1.
Exposure to hypo-osmolarity increases p75NTR expression in cell lines and in primary mouse cortical neurons. A, HEK293 cells were exposed to increasing hypo-osmolarity for 24 h, lysed, and analyzed for p75NTR and actin expression by immunoblot. Normal osmolarity is 100%. B, Primary mouse cortical neurons were exposed to normal medium or to hypo-osmolarity for 24 h, lysed, and analyzed for p75NTR and actin expression by immunoblot. C, HEK293 cells were exposed to hypo-osmolar medium (50%) or to the same medium supplemented with NaCl to restore normal osmolarity (50%+NaCl). After a 24 h exposure, cells were lysed and analyzed for p75NTR and actin expression by immunoblot. D, HEK293 cells were exposed to hypo-osmolarity (50%; Hypo) or were exposed to hypo-osmolarity for 24 h and returned to normal osmolarity (100% osm; Recovery) for the times indicated. After lysis, cells were analyzed for p75NTR and actin expression by immunoblot. Ctl, Control. E, HEK293 cells were exposed to normal medium or to hypo-osmolarity for 24 h and subjected to cell-surface biotinylation. Immunoblots of lysates (left) and streptavidin pulldowns (right) are shown. Arrows indicate the isoforms of p75NTR induced by hypo-osmolarity. F, Left, HEK293 cells were exposed to decreasing osmolarity for 24 h, lysed, and analyzed by immunoblot for levels of p75NTR, sortilin, NRH2, NRAGE, and actin. Right, The increase in p75NTR protein was quantified by densitometry of three repeats of the experiment (*p < 0.05, significant difference in p75NTR levels compared with 24 h exposure to normal medium). Experiments shown in A–E were repeated three times with identical results. osm, Osmolarity.
Figure 2.
Figure 2.
Hypo-osmolarity increases p75NTR mRNA levels. A, B, Primary mouse cortical neurons were exposed to 50% hypo-osmolar medium for different periods of time (A, left) or to different levels of hypo-osmolarity (B). RNA was extracted, and p75NTR and actin mRNAs were evaluated by RT-PCR, as described in Materials and Methods. The increase in p75NTR mRNA levels shown in A was quantified by densitometry of three repeats of the experiment (right) (*p < 0.05, significant difference in p75NTR levels compared with 24 h exposure to normal medium). C, Primary mouse cortical neurons were exposed to hypo-osmolarity (50% osm) or normal medium (100% osm) for 24 h in the presence or absence of actinomycin (Act; 1 μg/ml), and p75NTR and actin mRNAs were evaluated by RT-PCR. D, Primary mouse cortical neurons were exposed to hypo-osmolarity (50% osm) or normal medium (100% osm) for 24 h in the presence or absence of cycloheximide (CHX; 10 μg/ml), and p75NTR and actin mRNAs were evaluated by RT-PCR. All experiments shown were repeated three times. osm, Osmolarity.
Figure 3.
Figure 3.
The p75NTR promoter contains cis-elements that respond to hypo-osmolarity. A, A schematic representation of the relative positions of conserved regions in the p75NTR promoter. Boxes C1 to C7 and the proximal Sp1-rich region represent regions of >100 bp that contain at least 65% homology between mouse, rat, and human. B, The conserved fragments were cloned into a PGL3-Basic reporter and used to transfect HEK293 cells. Twenty-four hours after transfection, cells were exposed to either hypo-osmolar or normal medium for 18 h, lysed, and assayed for luciferase activity. The ratio of activity in hypo-osmolarity versus normal medium is presented. PP, Proximal promoter. C, The 3.7 kb proximal promoter and the indicated subdomains were assayed for luciferase activity as in B. The ratio of activity in hypo-osmolarity versus normal medium is presented. Experiments in C were performed four times with identical results, using triplicates or quadruplicates for each sample in each experiment. luc, Luciferase.
Figure 4.
Figure 4.
Sp1 DNA binding activity is increased in hypo-osmolar conditions. A, B, HEK293 cells (A) or primary cortical neurons (B) were exposed to hypo-osmolarity (50% osm) or normal osmolarity (100% osm) for 4 h, and the Sp1 binding activity was evaluated by EMSA. Antibodies directed against Sp1 (Sp1-ab) or Sp3 (SP3-ab) were used to supershift complexes bound to the Sp1 element. Major and minor complexes referred to in the text are indicated by the arrow and single arrowhead, respectively. Note that only small amounts of the supershifted complexes are present (double arrowheads), likely because these protein–DNA complexes are too large to enter the gel. The rightmost panel in A shows EMSAs performed using a labeled mutant Sp1 probe (mSP1 probe). C, HEK293 cells were exposed to hypo-osmolarity (50% osm) or normal osmolarity (100% osm) for 4 h, and the level of Sp1 bound to the endogenous p75NTR promoter was evaluated by CHIP assay. Experiments shown in A and B were repeated four times, and the experiment shown in C was repeated three times with identical results. PA, Probe alone; Pr, probe; Ab, antibody.
Figure 5.
Figure 5.
Sp1 is required for p75NTR expression induced by hypo-osmolarity. A, B, HEK293 cells were left untransfected (none) or were transfected with plasmids expressing dominant-negative Sp1 glutathione S-transferase (DN-Sp1-GST), full-length Sp1 (Sp1-FL), or GST alone (GST). Twenty-four hours after transfection, cells were exposed to hypo-osmolarity (50% osm) or normal osmolarity (100% osm) for 24 h, lysed, and analyzed for levels of p75NTR, GST, and Sp1 protein by immunoblot (A) or for p75NTR and actin mRNA by RT-PCR (B). C, HEK293 cells were transfected with small interfering RNA (siRNA) directed against Sp1 or were transfected with a scrambled control siRNA. The next day, the cells were exposed to hypo-osmolarity (50% osm) or normal osmolarity (100% osm) for 24 h, lysed, and analyzed for p75NTR, Sp1, and actin expression by immunoblot. D, HEK293 cells were exposed to hypo-osmolarity or to normal medium for 24 h in the presence of increasing doses of mithramycin A and analyzed for p75NTR, Sp1, and actin expression by immunoblot. E, Primary cortical neurons were exposed to hypo-osmolarity or to normal medium for 24 h in the presence of 250 μm mithramycin A for 24 h and analyzed for p75NTR and actin expression by immunoblot. All experiments shown were repeated three times with identical results. osm, Osmolarity; Mith, mithramycin A.
Figure 6.
Figure 6.
Sp1 levels are increased in response to hypo-osmolarity. HEK293 cells were exposed to increasing hypo-osmolarity, as indicated, for 24 h, lysed, and analyzed for Sp1 protein expression by immunoblot (A) or for Sp1 mRNA expression by RT-PCR (B). The increase in Sp1 protein was quantified by densitometry of three repeats of the experiment (A, right) (*p < 0.05, significant difference in Sp1 levels compared with 24 h exposure to normal medium). All experiments shown were repeated three times with identical results. osm, Osmolarity.
Figure 7.
Figure 7.
Exposure to hypo-osmolarity reduces Sp1 turnover. A, HEK293 cells were exposed to hypo-osmolarity (50% osm) or normal osmolarity (100% osm) in the presence or absence of cyclohexymide (CHX; 10 μg/ml) for 24 h, lysed in Totex buffer, and analyzed for p75NTR, Sp1, and actin expression by immunoblot. B, Left, Sp1 turnover was assessed by pulse–chase metabolic labeling, immunoprecipitation, SDS-PAGE, and flourography, as described in Materials and Methods. Right, Changes in 35S-labeled Sp1 levels were quantified by densitometry of three repeats of the experiment (*p < 0.05, significant difference in Sp1 level in cells exposed to hypo-osmolarity vs normal osmolarity for 6 h). NS, Nonspecific antibody; Sp1, Sp1 antibody. C, HEK293 cells were exposed to hypo-osmolarity (50%) or maintained in normal medium with normal osmolarity (100%) for 24 h in the presence or absence of inhibitors directed against PI3K (LY294002), PKC (Go6976), PLC (U73122), or NOS (L-NAME).

Similar articles

Cited by

References

    1. Andsberg G, Kokaia Z, Lindvall O. Upregulation of p75 neurotrophin receptor after stroke in mice does not contribute to differential vulnerability of striatal neurons. Exp Neurol. 2001;169:351–363. - PubMed
    1. Bhakar AL, Howell JL, Paul CE, Salehi AH, Becker EB, Said F, Bonni A, Barker PA. Apoptosis induced by p75NTR overexpression requires Jun kinase-dependent phosphorylation of Bad. J Neurosci. 2003;23:11373–11381. - PMC - PubMed
    1. Birnbaum MJ, van Wijnen AJ, Odgren PR, Last TJ, Suske G, Stein GS, Stein JL. Sp1 trans-activation of cell cycle regulated promoters is selectively repressed by Sp3. Biochemistry. 1995;34:16503–16508. - PubMed
    1. Bouwman P, Philipsen S. Regulation of the activity of Sp1-related transcription factors. Mol Cell Endocrinol. 2002;195:27–38. - PubMed
    1. Caprini M, Gomis A, Cabedo H, Planells-Cases R, Belmonte C, Viana F, Ferrer-Montiel A. GAP43 stimulates inositol trisphosphate-mediated calcium release in response to hypotonicity. EMBO J. 2003;22:3004–3014. - PMC - PubMed

Publication types

MeSH terms