. 2007 Feb 9;128(3):505-518.
doi: 10.1016/j.cell.2006.12.038.

Histone methylation-dependent mechanisms impose ligand dependency for gene activation by nuclear receptors

Affiliations

Histone methylation-dependent mechanisms impose ligand dependency for gene activation by nuclear receptors

Ivan Garcia-Bassets et al. Cell. .

Abstract

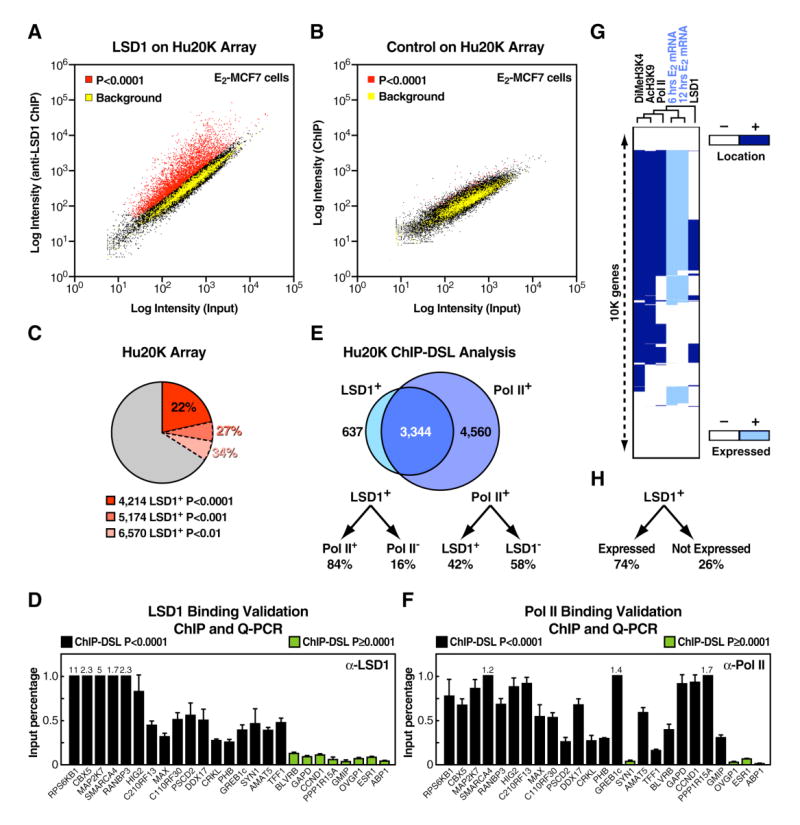
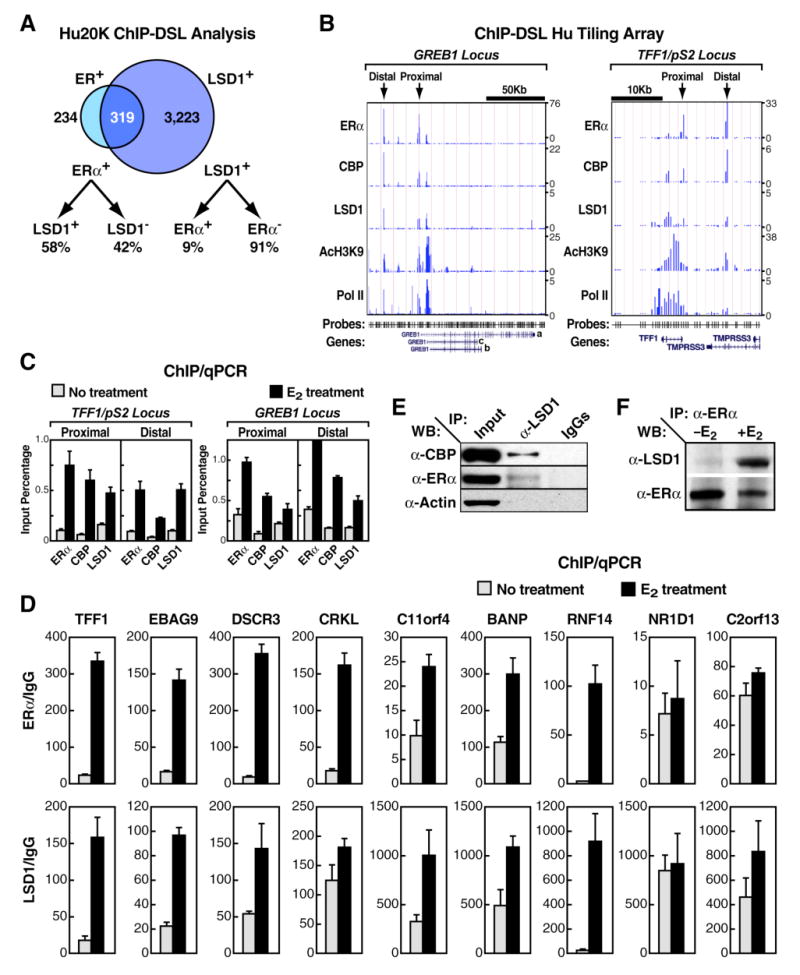
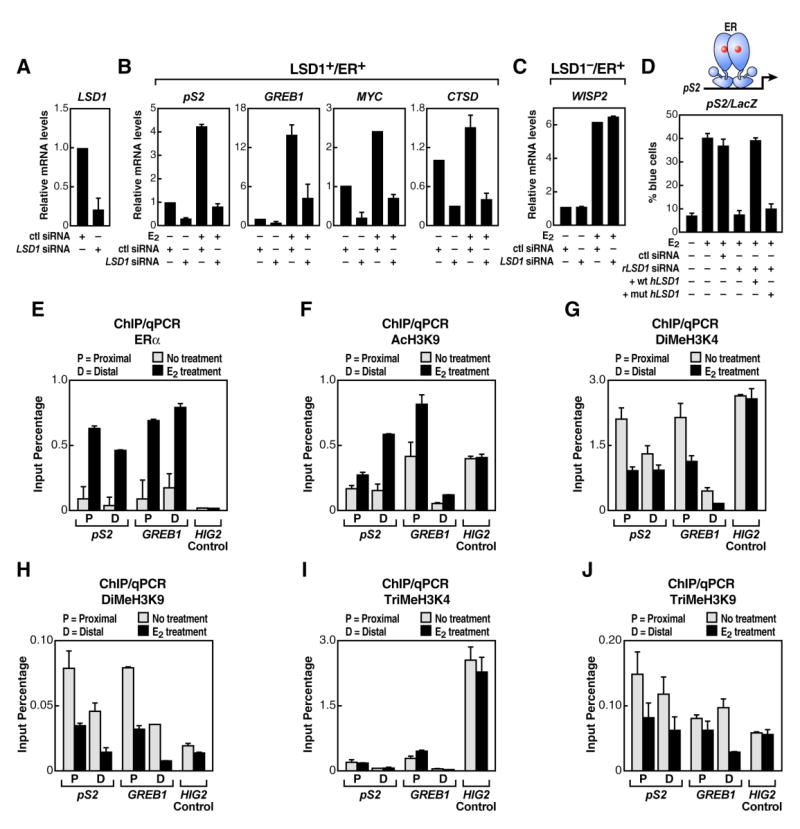
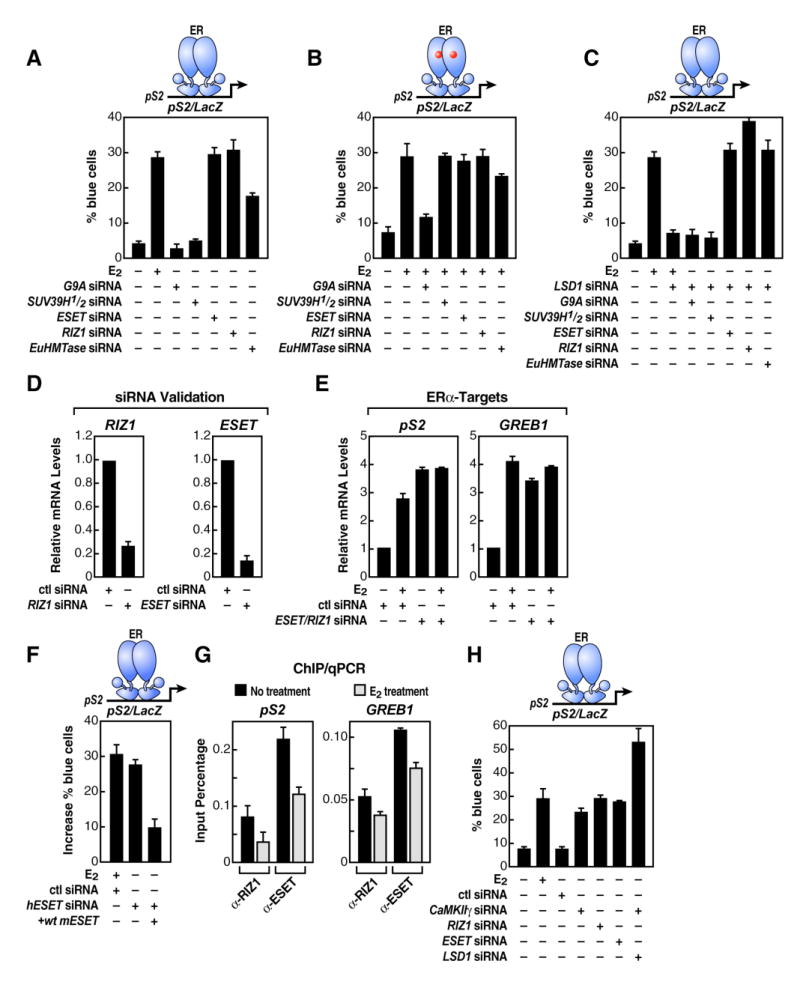
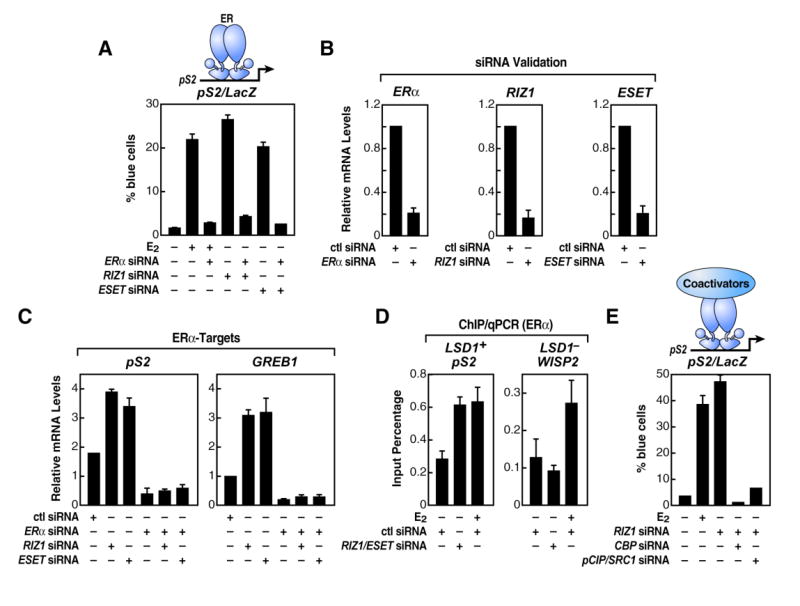
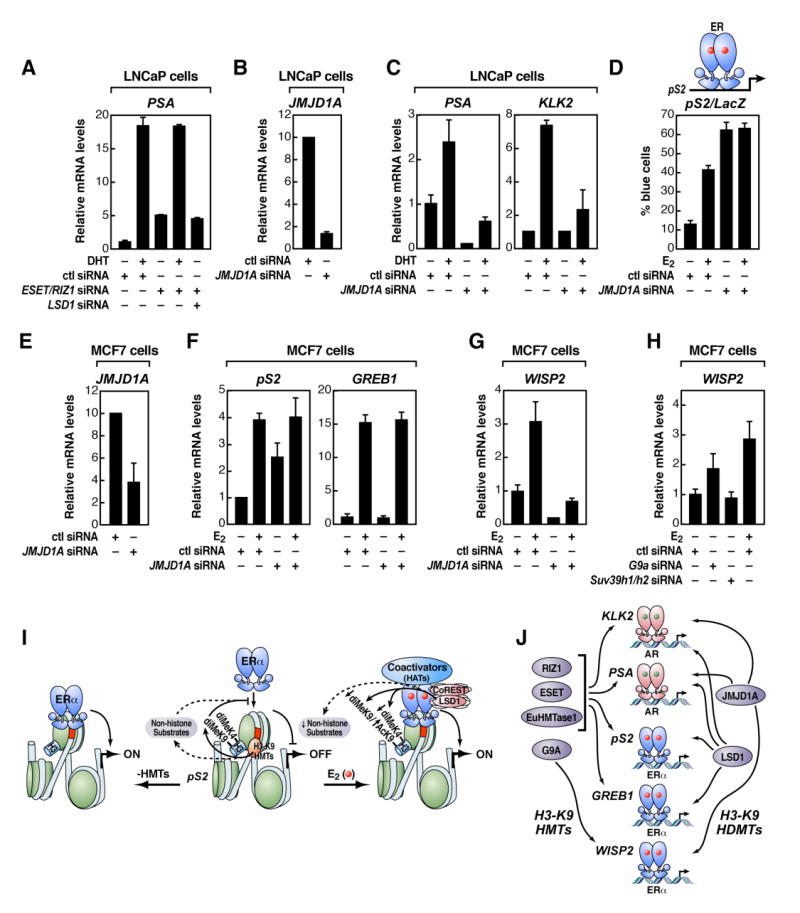
Nuclear receptors undergo ligand-dependent conformational changes that are required for corepressor-coactivator exchange, but whether there is an actual requirement for specific epigenetic landmarks to impose ligand dependency for gene activation remains unknown. Here we report an unexpected and general strategy that is based on the requirement for specific cohorts of inhibitory histone methyltransferases (HMTs) to impose gene-specific gatekeeper functions that prevent unliganded nuclear receptors and other classes of regulated transcription factors from binding to their target gene promoters and causing constitutive gene activation in the absence of stimulating signals. This strategy, based at least in part on an HMT-dependent inhibitory histone code, imposes a requirement for specific histone demethylases, including LSD1, to permit ligand- and signal-dependent activation of regulated gene expression. These events link an inhibitory methylation component of the histone code to a broadly used strategy that circumvents pathological constitutive gene induction by physiologically regulated transcription factors.


Figures

Figure 1
Figure 1. Genome-Wide Promoter Analysis Reveals the Association of LSD1 with a Broad Gene Activation Program
(A) Scatter plot of LSD1 recruitment to human gene promoters is shown. E2-induced MCF7 cells were profiled on the Hu20K array by ChIP-DSL. Three biological replicates were used to derive enriched promoters at p<0.0001 (red), shown in comparison with intergenic genomic sequences as negative controls (yellow). Weighted average is visualized on a single experiment scatter plot. (B) Scatter plot of a non relevant antibody profiled on the Hu20K array by ChIP-DSL is shown. Two biological replicates were used. (C) Number and percentage of LSD1+ promoters on the Hu20K array at different statistical cutoffs are shown. (D) ChIP/qPCR analysis of 17 LSD1+ and 8 LSD1 randomly selected promoters in E2-stimulated MCF7 cells is shown. The data are the average of three replicates, and error bars represent ± standard error mean. (E) Venn diagram of LSD1+ and Pol II+ promoters obtained by ChIP-DSL is shown. Only promoters with reliable signal intensities in both profiling experiments were included in the comparison. (F) ChIP/qPCR analysis of Pol II recruitment on selected LSD1+ and LSD1 promoters in E2-stimulated MCF7 cells is shown. The data are the average of three replicates, and error bars represent ± standard error mean. (G) Correlation of gene expression (light blue) with promoter occupancy (dark blue) is shown and includes histone modification marks (DiMeH3K4 and AcH3K9) as well as Pol II and LSD1, which were profiled in E2-induced MCF7 cells. Only genes included in both promoter- and expression-profiling arrays and reliably scored in all measurements were used to construct the binary map by unsupervised hierarchical clustering analysis. (H) LSD1+ genes classified by mRNA expression status are shown.
Figure 2
Figure 2. LSD1 Associates with Most ERα-Promoter Targets in MCF7 Cells
(A) Venn diagram of LSD1+ and ERα+ promoters as obtained by ChIP-DSL is shown. Only promoters with reliable signal intensities in both profiling experiments were included in the comparison. (B) ChIP-DSL tiling array analysis on GREB1 (left panel) and TFF1/pS2 (right panel) loci of ERα, CBP, LSD1, AcH3K9, and Pol II occupancy in E2-stimulated MCF7 cells is shown. Binding profiles represent ChIP versus input DNA intensity ratios (right). The most enriched ERα-binding sites (proximal and distal) are indicated by arrows. DSL probe location and RefSeq gene annotation are indicated in the bottom. (C) ChIP/qPCR recruitment analysis of ERα, CBP, and LSD1 on proximal and distal ERα-binding sites upon E2 treatment in MCF7 cells is shown. The data are the average of three replicates, and error bars represent ± standard error mean. (D) ChIP/qPCR analysis of LSD1 and ERα recruitment on additional LSD1+/ ERα+ promoters detected by ChIP-DSL assay upon E2 treatment in MCF7 cells is shown. The data are the average of three replicates, and error bars represent ± standard error mean. (E) Shows coimmunoprecipitation analysis of ERα and CBP by anti-LSD1 antibody in cell extracts obtained from E2-stimulated MCF7 cells. 5%input is shown. (F) Coimmunoprecipitation analysis of LSD1 by anti- ERα antibody in cell extracts obtained from unstimulated and E2-stimulated MCF7 cells is shown.
Figure 3
Figure 3. LSD1 Regulates E2-Dependent Gene Transcription While Both H3-K4 and H3-K9 Demethylation Events Are Observed
(A) Real-time qPCR (RT-qPCR) analysis is shown to document efficiency of LSD1 siRNA to diminish endogenous LSD1. (B) RT-qPCR analysis of several endogenous LSD1+/ ERα+-target genes upon LSD1 siRNA transfection is shown. (C) RT-qPCR analysis of an endogenous LSD1/ ERα+-target gene upon LSD1 depletion by siRNA is shown. In (A)-(C) LSD1 siRNA was delivered by transient transfection in MCF7 cells, and β-actin mRNA expression levels as well as cell transfection efficiency were used for normalization. (D) Functional rescue analysis of the wild-type (wt) and the amine oxidase mutant (mut) human LSD1 form (hLSD1) in Rat-1 cells is shown. Endogenous rat LSD1 (rLSD1) expression was depleted by specific rat LSD1 siRNA, and ectopic wt hLSD1 and mut hLSD1 overexpression was accomplished by expression plasmids. Reporter plasmid and LSD1 siRNA were delivered by single-cell nuclear microinjection in Rat-1 cells. (E-J) Panels show ChIP/qPCR occupancy analysis of ERα (E), acH3-K9 (F), diMeH3-K4 (G), diMeH3-K9 (H), TriMeH3-K4 (I), and TriMeH3-K9 (J) on ERα-binding sites in vehicle- or E2-treated MCF7 cells. ERα proximal or distal binding sites on pS2 and GREB1 genomic loci were examined; HIG2 promoter was included as control. The data in (A)-(J) are the average of three replicates, and error bars represent ± standard error mean.
Figure 4
Figure 4. Specific H3-K9 HMTs Function as Inhibitory Gatekeepers and Dictate LSD1 Dependency for ERα-Regulated Gene Activation
(A and B) Effect of different siRNAs to specific H3-K9 HMTs on pS2 promoter-LacZ reporter activity was analyzed by single-cell microinjection assay in the absence (A) and presence (B) of ligand (E2). (C) Functional LSD1 dependency of pS2 promoter-LacZ reporter activity was tested after depletion of specific H3-K9 HMTs. (D) RT-qPCR analysis was performed to document efficiency of H3-K9 HMTs siRNAs to diminish endogenous RIZ1 and ESET. (E) RT-qPCR analysis of endogenous ERα-target genes upon specific H3-K9 HMTs siRNA transfection is shown. (F) Functional rescue analysis of a mouse ESET form in HeLa cells is shown. Endogenous human ESET (hESET) expression was abolished by specific mouse ESET siRNA, and ectopic mouse ESET (mESET) overexpression was accomplished by expression plasmid. (G) Panel shows ChIP/qPCR recruitment analysis of RIZ1 and ESET on endogenous ERα-target promoters upon E2 stimulation in MCF7 cells. (H) Functional analysis of CaMKIIγ in absence of ligand (E2) on a pS2 promoter-LacZ reporter gene is shown. For experiments (A)-(C), (F), and (H) reporter plasmid and siRNAs were delivered by single-cell nuclear microinjection in MCF7 and HeLa (in F) cells. In (D) and (E) siRNAs were delivered by transient transfection in MCF7 cells, and β-actin expression levels and cell transfection efficiency were used for normalization. The data in (A)-(H) are the average of three replicates, and error bars represent ± standard error mean.
Figure 5
Figure 5. H3-K9 HMTs Impose Ligand Dependency to the E2-Dependent Signaling Pathway
(A) ERα dependency of the pS2 promoter-LacZ reporter activity is analyzed in absence of specific H3-K9 HMTs. (B) RT-qPCR analysis was performed to document efficiency of ERα, RIZ1, and ESET siRNAs to diminish endogenous ERα, RIZ1, and ESET. (C) RT-qPCR analysis of endogenous ERα-target genes after removing H3-K9 HMTs and ERα by siRNA is shown. (D) ChIP/qPCR recruitment analysis of ERα in cells transfected with specific H3-K9 HMTs siRNAs in absence or presence of ligand (E2) is shown. (E) Analysis of pS2 promoter-LacZ reporter activity upon removing the ERα-associated coactivators CBP, pCIP, and SRC1 in cells depleted of the H3-K9 HMT RIZ1. For experiments (A) and (E), reporter plasmid and siRNAs were delivered by single-cell nuclear microinjection in MCF7 cells. In (B)-(D), siRNAs were delivered by transient transfection in MCF7 cells, and β-actin mRNA expression levels and cell transfection efficiency were used for normalization. The data in (A)-(E) are the average of three replicates, and error bars represent ± standard error mean.
Figure 6
Figure 6. A Promoter-Specific HMT/HDM “Code” for Regulated Transcription Units
(A) RT-qPCR analysis of an endogenous LSD1+/AR+ gene target upon RIZ1/ESET and/or LSD1 depletion by siRNA in LNCaP cells is shown. (B) RT-qPCR analysis to document the efficiency of JMJD1A siRNA to diminish endogenous JMJD1A in LNCaP cells is shown. (C) RT-qPCR analysis of endogenous AR-target genes upon JMJD1A depletion by siRNA is shown. (D) Functional analysis of the pS2 promoter-LacZ reporter gene activity after removing JMJD1A by microinjection of siRNA in MCF7 cells is shown. (E) RT-qPCR analysis was performed to document efficiency of JMJD1A siRNA to diminish endogenous JMJD1A in MCF7 cells. (F) RT-qPCR gene expression analysis of endogenous LSD1+/ ERα+-target genes upon JMJD1A depletion by siRNA is shown. (G) RT-qPCR analysis of an endogenous LSD1/ ERα+-target gene upon JMJD1A depletion by siRNA is shown. (H) RT-qPCR gene expression analysis of an endogenous LSD1/ ERα+-target gene upon G9a or Suv39h1/h2 depletion by siRNA is shown. (I) Model of H3-K9 HMT requirement to inhibit constitutive ERα activation by blocking binding of the unliganded nuclear receptor to its cognate DNA sites is shown; HDMs, as LSD1, are required to demethylate H3-K9 HMTs substrates to permit activation by liganded ERα (see text for details). (J) Gene-specific use of HMT/HDMs to define regulated gene activation programs (see text for details) is shown. In all these experiments, siRNA was delivered by transient transfection in LNCaP (A)-(C) or MCF7 cells (D)-(H), and β-actin expression levels and cell transfection efficiency were used for normalization. The data in (A)-(H) are the average of three replicates ± standard error of the mean.

Comment in

Similar articles

Cited by

References

    1. Andres ME, Burger C, Peral-Rubio MJ, Battaglioli E, Anderson ME, Grimes J, Dallman J, Ballas N, Mandel G. CoREST: a functional corepressor required for regulation of neuralspecific gene expression. Proc Natl Acad Sci USA. 1999;96:9873–9878. - PMC - PubMed
    1. Ballas N, Battaglioli E, Atouf F, Andres ME, Chenoweth J, Anderson ME, Burger C, Moniwa M, Davie JR, Bowers WJ, et al. Regulation of neuronal traits by a novel transcriptional complex. Neuron. 2001;31:353–365. - PubMed
    1. Ballas N, Grunseich C, Lu DD, Speh JC, Mandel G. REST and its corepressors mediate plasticity of neuronal gene chromatin throughout neurogenesis. Cell. 2005;121:645–657. - PubMed
    1. Bannister AJ, Kouzarides T. The CBP co-activator is a histone acetyltransferase. Nature. 1996;384:641–643. - PubMed
    1. Bruce AW, Donaldson IJ, Wood IC, Yerbury SA, Sadowski MI, Chapman M, Gottgens B, Buckley NJ. Genome wide analysis of repressor element 1 silencing transcription factor/neuron-restrictive silencing factor (REST/NRSF) target genes. Proc Natl Acad Sci USA. 2004;101:10458–10463. - PMC - PubMed

Publication types