. 2007 Mar 30;282(13):9547-9555.
doi: 10.1074/jbc.M610931200. Epub 2007 Feb 8.

Inhibition of G alpha i2 activation by G alpha i3 in CXCR3-mediated signaling

Affiliations

Inhibition of G alpha i2 activation by G alpha i3 in CXCR3-mediated signaling

Brian D Thompson et al. J Biol Chem. .

Abstract

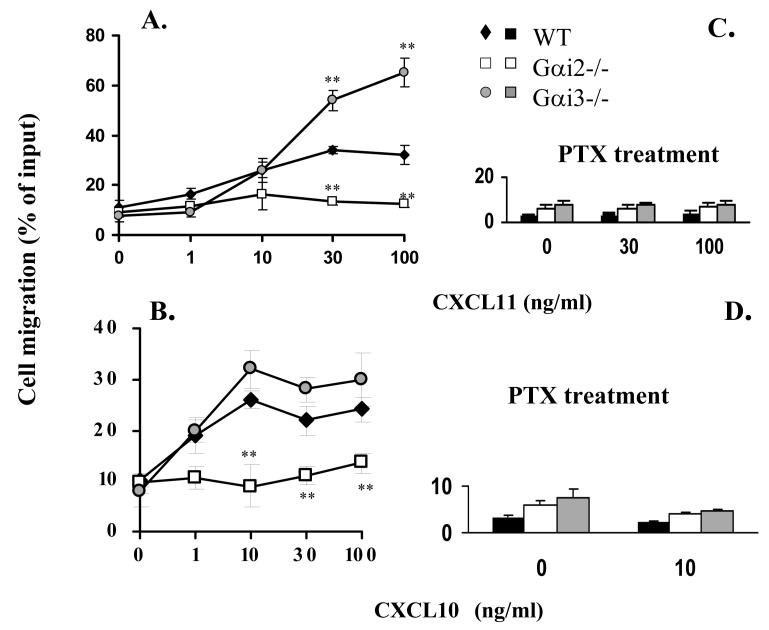
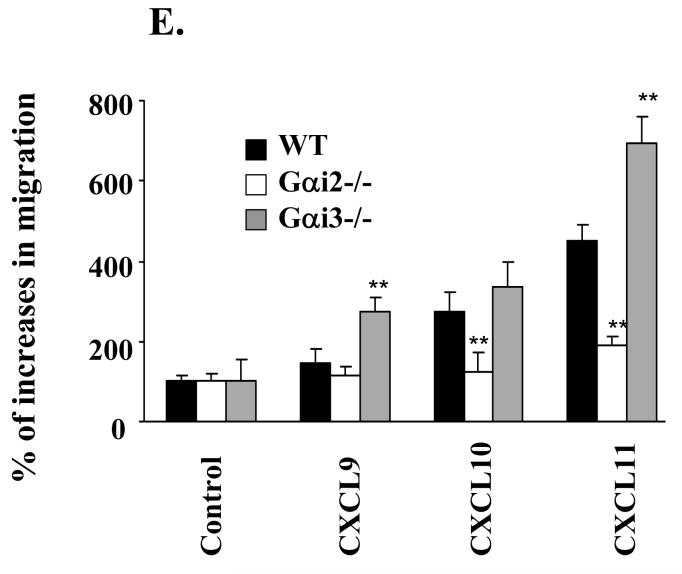
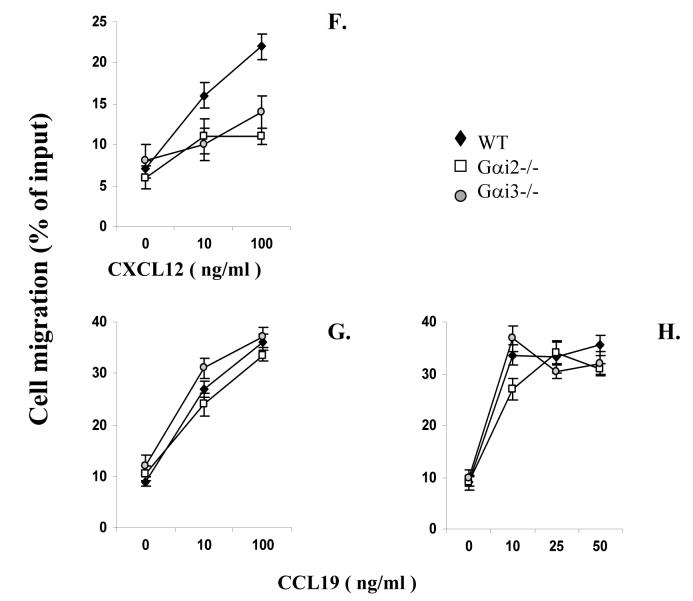
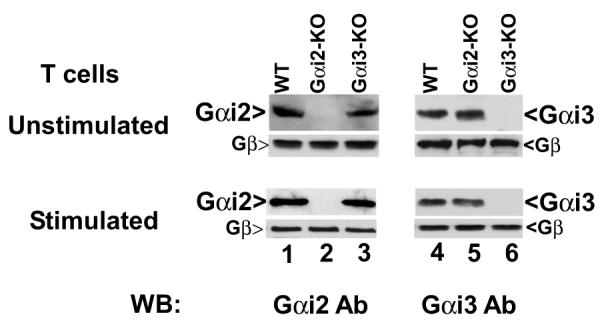
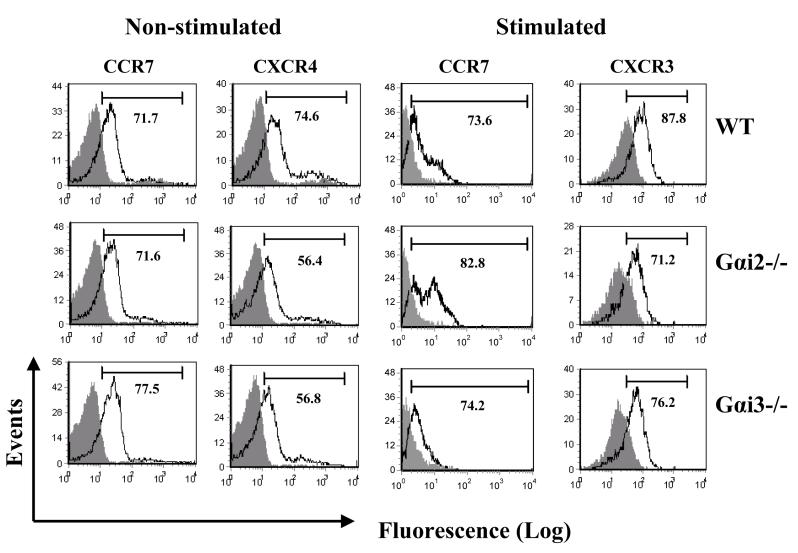
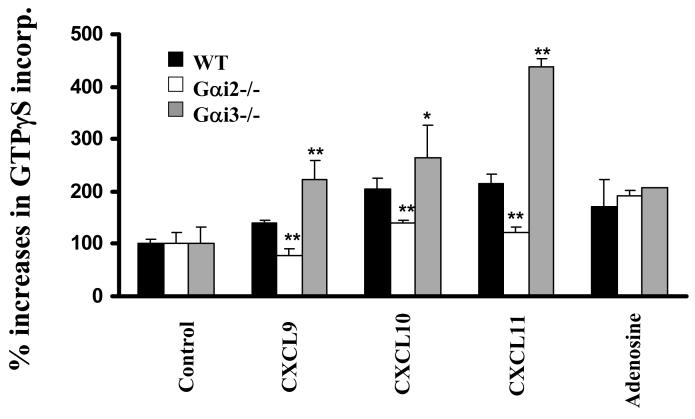
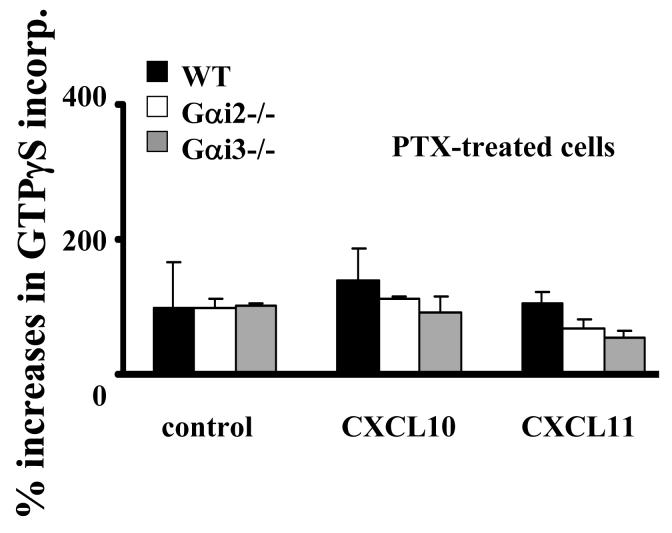
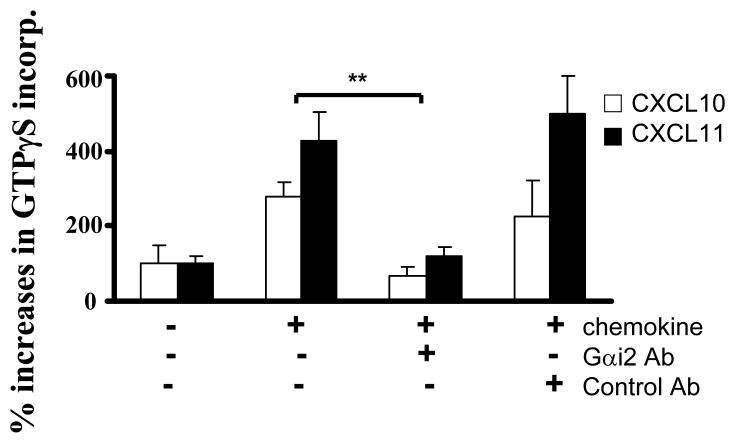
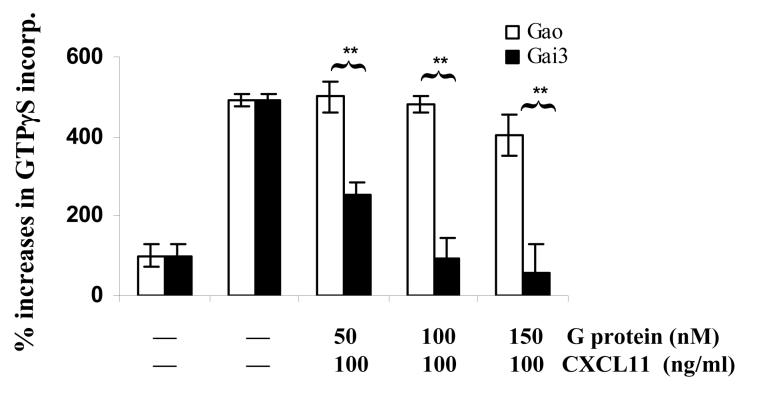
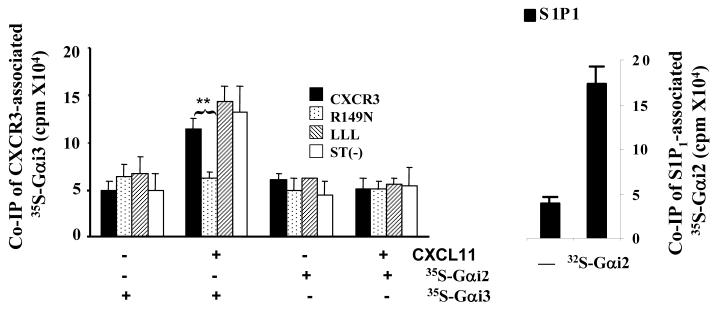
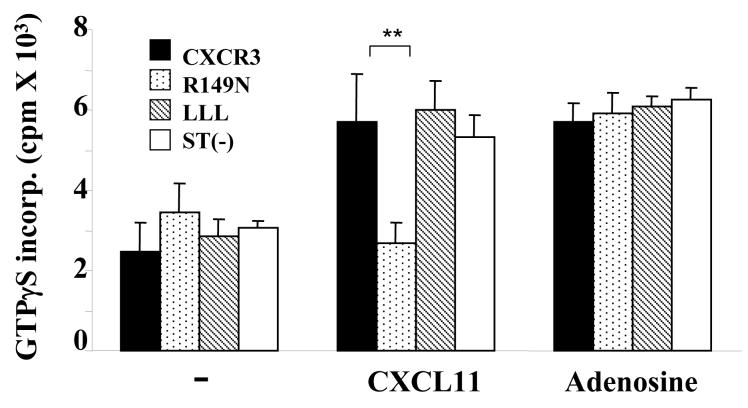
G protein-coupled receptors (GPCRs) convey extracellular stimulation into dynamic intracellular action, leading to the regulation of cell migration and differentiation. T lymphocytes express G alpha(i2) and G alpha(i3), two members of the G alpha(i/o) protein family, but whether these two G alpha(i) proteins have distinguishable roles guiding T cell migration remains largely unknown because of a lack of member-specific inhibitors. This study details distinct G alpha(i2) and G alpha(i3) effects on chemokine receptor CXCR3-mediated signaling. Our data showed that G alpha(i2) was indispensable for T cell responses to three CXCR3 ligands, CXCL9, CXCL10, and CXCL11, as the lack of G alpha(i2) abolished CXCR3-stimulated migration and guanosine 5'-3-O-(thio)triphosphate (GTPgammaS) incorporation. In sharp contrast, T cells isolated from G alpha(i3) knock-out mice displayed a significant increase in both GTPgammaS incorporation and migration as compared with wild type T cells when stimulated with CXCR3 agonists. The increased GTPgammaS incorporation was blocked by G alpha(i3) protein in a dose-dependent manner. G alpha(i3)-mediated blockade of G alpha(i2) activation did not result from G alpha(i3) activation, but instead resulted from competition or steric hindrance of G alpha(i2) interaction with the CXCR3 receptor via the N terminus of the second intracellular loop. A mutation in this domain abrogated not only G alpha(i2) activation induced by a CXCR3 agonist but also the interaction of G alpha(i3) to the CXCR3 receptor. These findings reveal for the first time an interplay of G alpha(i) proteins in transmitting G protein-coupled receptor signals. This interplay has heretofore been masked by the use of pertussis toxin, a broad inhibitor of the G alpha(i/o) protein family.


Figures

FIGURE 1
FIGURE 1
Chemotactic responses in the presence or absence of Gαi2 or Gαi3. A-E. Gαi2 and Gαi3 have opposing effects on CXCR3-stimulated chemotaxis. Activated T cells prepared from wild type (WT), Gαi2-/-, and Gαi3-/- mice were either left untreated (A-B, and E) or treated with 100 ng/ml PTX overnight (C and D), and then added to the upper chamber. CXCR3 agonists at indicated concentrations were added to the lower chamber in triplicate. After 4 hr incubation, the migrated cells in the lower chamber were collected and counted. Data are presented as mean percentages ± standard derivations (SD) of cell migration relative to cell input. One representative experiment in A-D and cumulative data from at least five independent experiments (n = 15) in E are shown. Chemokine concentrations used in E were the optimal concentrations for stimulating maximal migration toward CXCL9 (100ng/ml), CXCL10 (10ng/ml), CXCL11 (100ng/ml). Medium controls are designated as 100% and mean percentages ± SD of cell migration relative to the control are shown. * and **, statistical significance (p < 0.05) or (p < 0.01) respectively, in the presence vs. absence of a specific Gαi protein. F-H. Varying effects of Gαi2 and Gαi3 on T cell chemotaxis induced by different chemokines. The migration was assayed as above, except that non-stimulated T cells were used in place of activated T cells in chemotactic responses to CXCL12 and CCL19 in F and G. Data are presented as mean percentages ± SD of cell migration relative to cell input as A and B. One representative result of three independent experiments with each performed in triplicate.
FIGURE 1
FIGURE 1
Chemotactic responses in the presence or absence of Gαi2 or Gαi3. A-E. Gαi2 and Gαi3 have opposing effects on CXCR3-stimulated chemotaxis. Activated T cells prepared from wild type (WT), Gαi2-/-, and Gαi3-/- mice were either left untreated (A-B, and E) or treated with 100 ng/ml PTX overnight (C and D), and then added to the upper chamber. CXCR3 agonists at indicated concentrations were added to the lower chamber in triplicate. After 4 hr incubation, the migrated cells in the lower chamber were collected and counted. Data are presented as mean percentages ± standard derivations (SD) of cell migration relative to cell input. One representative experiment in A-D and cumulative data from at least five independent experiments (n = 15) in E are shown. Chemokine concentrations used in E were the optimal concentrations for stimulating maximal migration toward CXCL9 (100ng/ml), CXCL10 (10ng/ml), CXCL11 (100ng/ml). Medium controls are designated as 100% and mean percentages ± SD of cell migration relative to the control are shown. * and **, statistical significance (p < 0.05) or (p < 0.01) respectively, in the presence vs. absence of a specific Gαi protein. F-H. Varying effects of Gαi2 and Gαi3 on T cell chemotaxis induced by different chemokines. The migration was assayed as above, except that non-stimulated T cells were used in place of activated T cells in chemotactic responses to CXCL12 and CCL19 in F and G. Data are presented as mean percentages ± SD of cell migration relative to cell input as A and B. One representative result of three independent experiments with each performed in triplicate.
FIGURE 2
FIGURE 2
Gαi and chemokine receptor expression A. Gαi expression in T cells by immunoblotting analysis. Cell membranes of unstimulated (upper panel) or stimulated (lower panel) T cells prepared from indicated mice were analyzed by immunoblotting using anti-Gαi2 specific monoclonal Ab (left panel). Cell membranes with Gαi2 depletion were analyzed by anti-Gαi3 Ab (right panel). The blots were stripped and re-probed with anti-G protein pan β subunit Ab for equal protein loading controls. One representative result of four (left) or two (right) experiments performed is shown. B. Analysis of chemokine receptor expression on T cells. T cells prepared from indicated mice were either left unstimulated for staining CCR7 and CXCR4 receptors or stimulated with Con A for 4 days for measuring CCR7 and CXCR3 expression on a flow cytometer. The numbers within the panels indicate the percentages of positive cells on gated CD3+ T cell population. Representative results of four (CXCR3) and three (CXCR4 and CCR7) experiments performed are shown.
FIGURE 2
FIGURE 2
Gαi and chemokine receptor expression A. Gαi expression in T cells by immunoblotting analysis. Cell membranes of unstimulated (upper panel) or stimulated (lower panel) T cells prepared from indicated mice were analyzed by immunoblotting using anti-Gαi2 specific monoclonal Ab (left panel). Cell membranes with Gαi2 depletion were analyzed by anti-Gαi3 Ab (right panel). The blots were stripped and re-probed with anti-G protein pan β subunit Ab for equal protein loading controls. One representative result of four (left) or two (right) experiments performed is shown. B. Analysis of chemokine receptor expression on T cells. T cells prepared from indicated mice were either left unstimulated for staining CCR7 and CXCR4 receptors or stimulated with Con A for 4 days for measuring CCR7 and CXCR3 expression on a flow cytometer. The numbers within the panels indicate the percentages of positive cells on gated CD3+ T cell population. Representative results of four (CXCR3) and three (CXCR4 and CCR7) experiments performed are shown.
FIGURE 3
FIGURE 3
CXCR3 agonist-stimulated G protein activation in the presence or absence of Gαi2 or Gαi3. A. CXCR3 agonist-stimulated GTPγS incorporation in activated T cells. Cell membranes equivalent to 20μg protein prepared from activated T cells with or without Gαi2 or Gαi3 were stimulated in triplicate with 100ng/ml CXCL9, 10ng/ml CXCL10, 100ng/ml CXCL11, or 10 μM adenosine in the presence of 0.3 nM 35S-GTPγS as described in materials and methods. Percentages ± SD of specific 35S-GTPγS incorporation relative to background controls are shown with unstimulated cell membranes designed as 100%. The result represents four separate experiments. * and ** are statistical significance (p < 0.05) or high significance (p < 0.01), respectively, in the presence vs. absence of a specific Gαi protein. B. Inhibition of G protein activation by PTX treatment. Activated T cells prepared from indicated mice were treated with 10ng/ml PTX for 1 hr before the cell membranes were prepared and assayed for GTPγS incorporation induced by either 10ng/ml CXCL10 or 100ng/ml CXCL11 as Figure 3A. Data represent three separate experiments with each sample in triplicate as Figure 3A. C. A blockade of G protein activation in Gαi3-/- T cell membrane by anti-Gαi2 Ab. G protein activation in cell membrane prepared from Gαi3-/- T cells was assayed in the presence of either 3 μg anti-Gαi2 monoclonal Ab or isotype-matched control Ab (Control Ab) during chemokine stimulation as in A. The data represent three independent experiments with each sample in triplicate as A. ** statistical significance (p < 0.01) in the presence vs. absence of a specific anti-Gαi2 Ab. D. Inhibition of Gαi2 activation in Gαi3-/- T cell membranes by exogenous Gαi3 protein. Cell membranes prepared from Gαi3-/- T cells were pre-incubated with indicated concentrations of in vitro synthesized Gαi3 or Gαo protein before stimulation of the membrane by 100 ng/ml CXCL11 and assaying G protein activation as in A. The data represent three separate experiments with each sample in triplicate. * and **, statistical significance (p < 0.05) or (p < 0.01), respectively, in the presence of Gαi3 vs. Gαo protein.
FIGURE 3
FIGURE 3
CXCR3 agonist-stimulated G protein activation in the presence or absence of Gαi2 or Gαi3. A. CXCR3 agonist-stimulated GTPγS incorporation in activated T cells. Cell membranes equivalent to 20μg protein prepared from activated T cells with or without Gαi2 or Gαi3 were stimulated in triplicate with 100ng/ml CXCL9, 10ng/ml CXCL10, 100ng/ml CXCL11, or 10 μM adenosine in the presence of 0.3 nM 35S-GTPγS as described in materials and methods. Percentages ± SD of specific 35S-GTPγS incorporation relative to background controls are shown with unstimulated cell membranes designed as 100%. The result represents four separate experiments. * and ** are statistical significance (p < 0.05) or high significance (p < 0.01), respectively, in the presence vs. absence of a specific Gαi protein. B. Inhibition of G protein activation by PTX treatment. Activated T cells prepared from indicated mice were treated with 10ng/ml PTX for 1 hr before the cell membranes were prepared and assayed for GTPγS incorporation induced by either 10ng/ml CXCL10 or 100ng/ml CXCL11 as Figure 3A. Data represent three separate experiments with each sample in triplicate as Figure 3A. C. A blockade of G protein activation in Gαi3-/- T cell membrane by anti-Gαi2 Ab. G protein activation in cell membrane prepared from Gαi3-/- T cells was assayed in the presence of either 3 μg anti-Gαi2 monoclonal Ab or isotype-matched control Ab (Control Ab) during chemokine stimulation as in A. The data represent three independent experiments with each sample in triplicate as A. ** statistical significance (p < 0.01) in the presence vs. absence of a specific anti-Gαi2 Ab. D. Inhibition of Gαi2 activation in Gαi3-/- T cell membranes by exogenous Gαi3 protein. Cell membranes prepared from Gαi3-/- T cells were pre-incubated with indicated concentrations of in vitro synthesized Gαi3 or Gαo protein before stimulation of the membrane by 100 ng/ml CXCL11 and assaying G protein activation as in A. The data represent three separate experiments with each sample in triplicate. * and **, statistical significance (p < 0.05) or (p < 0.01), respectively, in the presence of Gαi3 vs. Gαo protein.
FIGURE 4
FIGURE 4
Similar structural requirement for Gαi3 binding to the CXCR3 receptor and for Gαi2 activation. A. Analysis of CXCR3 expression in transfected Cos-7 cells. Cos-7 cells transfected with WT or mutated CXCR3 receptors were stained with anti-CXCR3 Ab conjugated with Alexa and analyzed by flow cytometry. Percentages of CXCR3+ cells on gated viable cell populations are indicated within the panels, where the filled profiles are negative controls obtained by isotype-matched control Ab conjugated with Alexa. One representative result of three experiments performed is shown. B. Interaction of Gαi3 with the CXCR receptor at the G protein-binding domain. Cell membranes prepared from Cos-7 cells transfected with constructs harboring either WT or CXCR3 receptor variants were incubated with 35S-labeled Gαi2 or 35S-labeled Gαi3 protein for 2 hrs and then stimulated with 100ng/ml CXCL11. The associated Gαi proteins were immunoprecipitated by anti-CXCR3 Ab and quantified by scintillation counting on a 1450 MicroBeta scintillation counter (left panel). Association of 35S-Gαi2 with the S1P1 receptor in unstimulated cell membrane was also shown as a 35S-Gαi2 binding control (right panel). Data represent three separate experiments with two samples per assay (n = 6). **, statistical significance (p < 0.01) obtained by comparing mutated CXCR3 receptors with the WT one. C. Requirement of the G protein-binding motif for Gαi2 activation. Cell membranes prepared from Cos-7 cells transfected with indicated constructs as in A were stimulated with 100ng/ml CXCL11 or 10 μM adenosine in the presence of 0.3 nM 35S-GTPγS and the resultant 35S-GTPγS incorporation was measured as Figure 3A. The data represent three separate experiments with each sample in triplicate (n = 9). **, statistical significance (p < 0.01) obtained by comparing mutated CXCR3 receptors with the WT receptor.
FIGURE 4
FIGURE 4
Similar structural requirement for Gαi3 binding to the CXCR3 receptor and for Gαi2 activation. A. Analysis of CXCR3 expression in transfected Cos-7 cells. Cos-7 cells transfected with WT or mutated CXCR3 receptors were stained with anti-CXCR3 Ab conjugated with Alexa and analyzed by flow cytometry. Percentages of CXCR3+ cells on gated viable cell populations are indicated within the panels, where the filled profiles are negative controls obtained by isotype-matched control Ab conjugated with Alexa. One representative result of three experiments performed is shown. B. Interaction of Gαi3 with the CXCR receptor at the G protein-binding domain. Cell membranes prepared from Cos-7 cells transfected with constructs harboring either WT or CXCR3 receptor variants were incubated with 35S-labeled Gαi2 or 35S-labeled Gαi3 protein for 2 hrs and then stimulated with 100ng/ml CXCL11. The associated Gαi proteins were immunoprecipitated by anti-CXCR3 Ab and quantified by scintillation counting on a 1450 MicroBeta scintillation counter (left panel). Association of 35S-Gαi2 with the S1P1 receptor in unstimulated cell membrane was also shown as a 35S-Gαi2 binding control (right panel). Data represent three separate experiments with two samples per assay (n = 6). **, statistical significance (p < 0.01) obtained by comparing mutated CXCR3 receptors with the WT one. C. Requirement of the G protein-binding motif for Gαi2 activation. Cell membranes prepared from Cos-7 cells transfected with indicated constructs as in A were stimulated with 100ng/ml CXCL11 or 10 μM adenosine in the presence of 0.3 nM 35S-GTPγS and the resultant 35S-GTPγS incorporation was measured as Figure 3A. The data represent three separate experiments with each sample in triplicate (n = 9). **, statistical significance (p < 0.01) obtained by comparing mutated CXCR3 receptors with the WT receptor.

Similar articles

Cited by

References

    1. Wilkie TM, Gilbert DJ, Olsen AS, Chen XN, Amatruda TT, Korenberg JR, Trask BJ, de Jong P, Reed RR, Simon MI. Nat.Genet. 1992;1:85–91. - PubMed
    1. Fields TA, Casey PJ. Biochem.J. 1997;321(Pt 3):561–571. - PMC - PubMed
    1. Kaslow HR, Burns DL. FASEB J. 1992;6:2684–2690. - PubMed
    1. Kehrl JH. Immunity. 1998;8:1–10. - PubMed
    1. Sunyer T, Monastirsky B, Codina J, Birnbaumer L. Mol.Endocrinol. 1989;3:1115–1124. - PubMed

Publication types

MeSH terms