. 2007 May 15;109(10):4518-27.
doi: 10.1182/blood-2006-10-054247. Epub 2007 Feb 8.

Checkpoint-apoptosis uncoupling in human and mouse embryonic stem cells: a source of karyotpic instability

Affiliations

Checkpoint-apoptosis uncoupling in human and mouse embryonic stem cells: a source of karyotpic instability

Charlie Mantel et al. Blood. .

Abstract

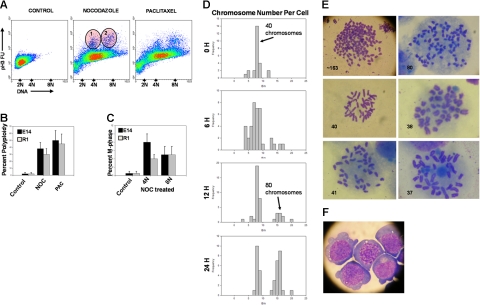
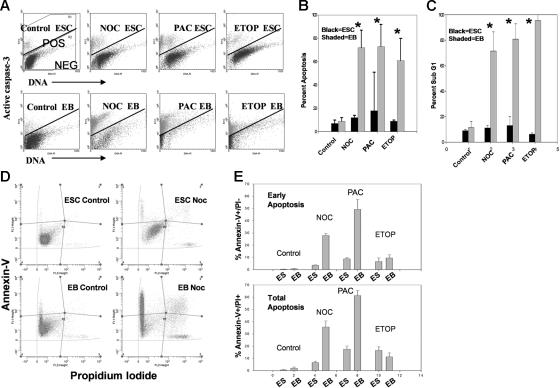
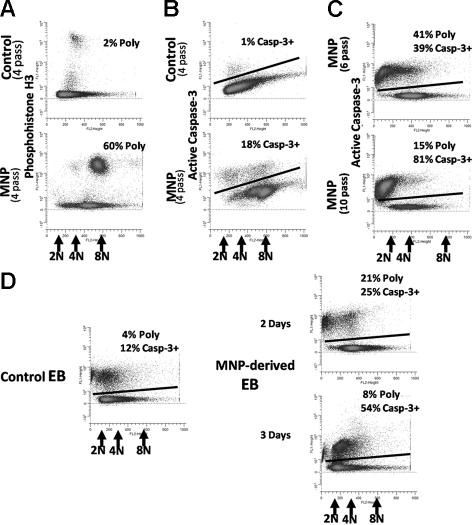
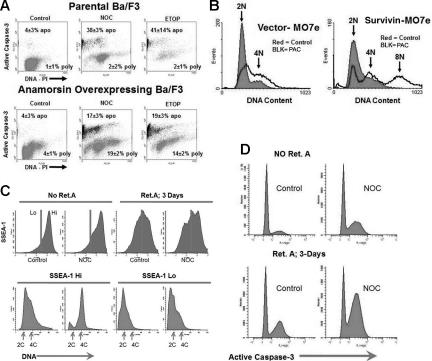
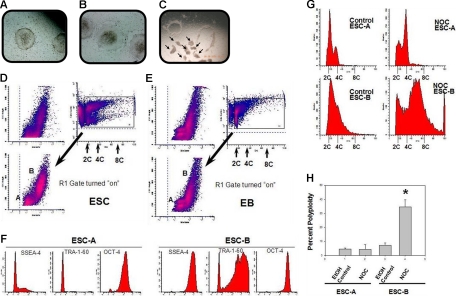
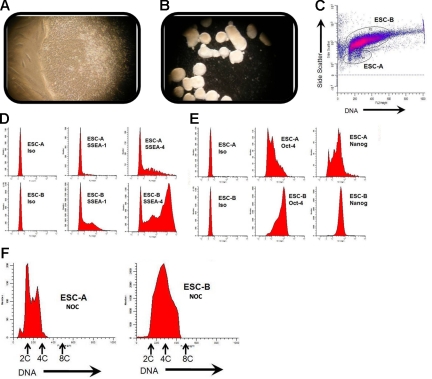
Karyotypic abnormalities in cultured embryonic stem cells (ESCs), especially near-diploid aneuploidy, are potential obstacles to ESC use in regenerative medicine. Events causing chromosomal abnormalities in ESCs may be related to events in tumor cells causing chromosomal instability (CIN) in human disease. However, the underlying mechanisms are unknown. Using multiparametric permeabilized-cell flow cytometric analysis, we found that the mitotic-spindle checkpoint, which helps maintain chromosomal integrity during all cell divisions, functions in human and mouse ESCs, but does not initiate apoptosis as it does in somatic cells. This allows an unusual tolerance to polyploidy resulting from failed mitosis, which is common in rapidly proliferating cell populations and which is reduced to near-diploid aneuploidy, which is also common in human neoplastic disease. Checkpoint activation in ESC-derived early-differentiated cells results in robust apoptosis without polyploidy/aneuploidy similar to that in somatic cells. Thus, the spindle checkpoint is "uncoupled" from apoptosis in ESCs and is a likely source of karyotypic abnormalities. This natural behavior of ESCs to tolerate/survive varying degrees of ploidy change could complicate genome-reprogramming studies and stem-cell plasticity studies, but could also reveal clues about the mechanisms of CIN in human tumors.


Figures

Figure 1
Figure 1
Microtubule disruption-induced mitotic arrest and polyploidy in mESCs. mESC lines E14 and R1 were treated with nocodazole (for microtubule depolymerization), paclitaxel (for microtubule overstabilization), or control solvent for 24 hours in complete culture medium containing LIF as described in “Materials and methods.” (A) Cells were harvested and assayed by multivariate permeabilized-cell cell-cycle analysis for simultaneous phospho(ser10)histone-H3 and DNA content. Regions 1 and 2 indicate E14 cells that are in M phase as indicated by increased phosphohistone-H3 content at 4C and 8C DNA content. (B) Results of polyploidy (cells with > 4C DNA content) analysis in E14 and R1 cells from 6 independent experiments is shown as the mean ± 1SD. (C) Percentage of M-phase cells (regions 1 and 2) are shown. (D) Relative frequency histograms of chromosome number in metaphase E14 cells treated with nocodazole for the indicated times showing an average of 40 chromosomes per cell (euploid) at 0 time and showing the increase in cells with 80 chromosomes (tetraploid) at 24 hours. Chromosome number indicates BIN number times 5. The experiment was repeated once with the E14 cell line and once with the R1 cell line with similar results. Chromosome counts in normal MEF cells are shown for comparison in Figure S2C. MEF cells had 40 chromosomes per cell. (E) Typical metaphase chromosome appearance in E14 cells before and after nocodazole treatment; the number of chromosomes is indicated (Nikon Labophot-2; 10 × 100; oil). (F) Wright-Giemsa stain of E14 cells harvested 24 hours after nocodazole treatment displaying a single nucleus. No E14 cells with more than 1 nucleus were observed (Nikon Labophot-2; 10 × 40).
Figure 2
Figure 2
Analysis of apoptosis of E14 cells before and after treatment with microtubule-disrupting agents or after DNA damage. (A) E14 mESCs were treated with the indicated agent for 24 hours and harvested as in Figure 1. Cells were analyzed by permeabilized-cell flow cytometry as in Figure 1 except an antibody to activated caspase-3 was used. Cells above the bar are positive and those below the bar are negative for caspase-3 activation. (B) Caspase-3 activation in day-3 mEB cells after 24 hours of treatment. Percentage apoptosis (mean ± 1SD for 3 independent experiments) as indicated by caspase-3 activation. (C) Percentage apoptosis (mean ± 1SD for 3 independent experiments) as indicated by sub-G1 cells. *Statistically significant difference from control; P < .05. (D-E) Apoptosis measurement in treated and untreated mESCs or mEB cells as indicated by Annexin-V binding. Cells were simultaneously stained with propidium iodide to indicate cellular membrane integrity. Early apoptosis (Annexin-V+ and PI+) and total apoptosis (Annexin-V+ and PI+/−) for E14 or mEB cells before and after treatment as in panels A and B. Results are mean percentages ± 1SD for 3 independent experiments.
Figure 3
Figure 3
Apoptosis and cell-cycle analysis in preformed mouse polyploidy ESCs and their EB formation after expansion culture. Phosphohistone H3 (A) and caspase-3 (B) is shown in control (solvent-treated) E14 cells or in preformed polyploid (MNP) cells after cells were washed free of nocodazole or control solvent, recultured in complete medium containing LIF, and expanded by subculture for 4 passages (4-pass). They were then harvested, and multivariate cell-cycle analysis performed as in Figure 1. DNA content, percentage of polyploidy, and percentage of apoptosis are numerically indicated. (C) Apoptosis and polyploidy after 6 and 10 expansion passages of MNP is numerically shown. (D) Untreated control and MNP cells from panel A were then washed free of LIF and placed into EB medium for the indicated time, then harvested and apoptosis analysis done. DNA content and numerical percentages of polyploidy and apoptosis for untreated control cell–derived mEB cells and MNP-derived mEB cells are indicated. This experiment was repeated once with similar results.
Figure 4
Figure 4
Intrinsic apoptosis-suppression uncouples somatic cells, while differentiation of mESCs in the presence of LIF does not prevent coupling. Ba/F3 cells and their derivatives containing an expression vector for overexpressing anamorsin were treated with control solvent or nocodazole or etoposide for 48 hours, then harvested and cell cycle/apoptosis analysis performed (A) as in Figure 2A. Percentages of polyploidy and apoptosis (mean ± 1SD) from 3 experiments is shown. (B) MO7e cells expressing empty vector or a vector containing survivin. Cells were treated with paclitaxel or control solvent for 48 hours then harvested, and cell-cycle analysis was performed. This experiment was repeated once with similar results. (C) E14 mESCs were treated with RA for 3 days, than treated for 1 additional day with nocodazole added. SSEA-1 expression is shown in the top panel, and cell-cycle analysis of SSEA-1-Hi and SSEA-1-Lo gated cells is shown in the bottom panel. (D) Caspase-3 activation in cultures from panel C.
Figure 5
Figure 5
Colonies of the hESC line MI01 contain 2 cell types distinguishable by laser-light scatter patterns, expression of pluripotent markers, and polyploidization in response to SAC activation. Morphology of typical (A) or atypical (B) MI01 colonies is shown. (C) Examples of microsurgical harvesting of typical colonies. Arrows indicate cut and lifted clumps of cells from colonies (Olympus S751; 10 × 20). (D) Flow cytometric analysis of laser-light scatter pattern and DNA content was used to distinguish 2 populations, hESC-A and hESC-B, in single-cell suspensions of harvested MI01 colonies. DNA content versus laser-light side-scatter is indicated. The R1 gate was used to separate viable cells from hypodiploid cells and cell debris. The ratio of percentages of hESC-A and hESC-B cells was 0.52 ± 0.21 for 6 separate experiments. Nocodazole treatment had no significant effect on this percent (P > .05; Figure S6). MI01 colonies were harvested, washed, and placed into human EB medium and cultured for 4 days, then hEBs were harvested and single cell suspensions were analyzed (E) as in panel D. Results are representative of 2 experiments. (F) Pluripotent marker expression of hESC-A and hESC-B. Isotype control antibody-staining intensity was below 10 fluorescence units (not shown). Data are representative of 2 experiments. hESC-A and hESC-B were treated with nocodazole or control solvent as in Figure 1 and harvested. hESC-A and hESC-B cells were gated as in Figure 5D. (G) Cell-cycle analysis was performed and DNA content is shown. (H) Percentage of polyploidy (mean ± 1SD) from 3 experiments. *Significant difference (P < .01) for nocodazole-treated hESC-Bs compared with control hESC-Bs.
Figure 6
Figure 6
Colonies of the hESC line HSF-6 also contain 2 populations that differ in marker expression and nocodazole-induced polyploidy. Colony edge of HSF-6 (A) and hEB (B) formation (Nikon Diaphot; panel A, 10 × 40; panel B, 10 × 20). HSF-6 colonies contain 2 populations based on laser-light scatter pattern (C) analogous to MI01 (Figure 5D). (D-E) Pluripotent marker expression along with nonspecific isotype control antibody binding. HSF-6 colonies were harvested and analyzed as in Figure 5. Cell-cycle analysis of gated hESC-A and hESC-B populations after treatment with nocodazole (F) was done as in Figure 5. Data represent 2 independent experiments.

References

    1. Huppertz B, Herrler A. Regulation of proliferation and apoptosis during development of the preimplantation embryo and the placenta. Birth Defects Res C Embryo Today. 2005;75:249–261. - PubMed
    1. Jefford CE, Irminger-Finger I. Mechanisms of chromosome instability in cancers. Crit Rev Oncol Hematol. 2006;59:1–14. - PubMed
    1. Burdon T, Smith A, Savatier P. Signalling, cell cycle and pluripotency in embryonic stem cells. Trends Cell Biol. 2002;12:432–438. - PubMed
    1. Holway AH, Kim SH, La Volpe A, Michael WM. Checkpoint silencing during the DNA damage response in Caenorhabditis elegans embryos. J Cell Biol. 2006;172:999–1008. - PMC - PubMed
    1. Fluckiger AC, Marcy G, Marchand M, et al. Cell cycle features of primate embryonic stem cells. Stem Cells. 2006;24:547–556. - PMC - PubMed

Publication types

Substances