. 2007 Feb 9;315(5813):848-53.
doi: 10.1126/science.1136678.

Relative impact of nucleotide and copy number variation on gene expression phenotypes

Affiliations

Relative impact of nucleotide and copy number variation on gene expression phenotypes

Barbara E Stranger et al. Science. .

Abstract

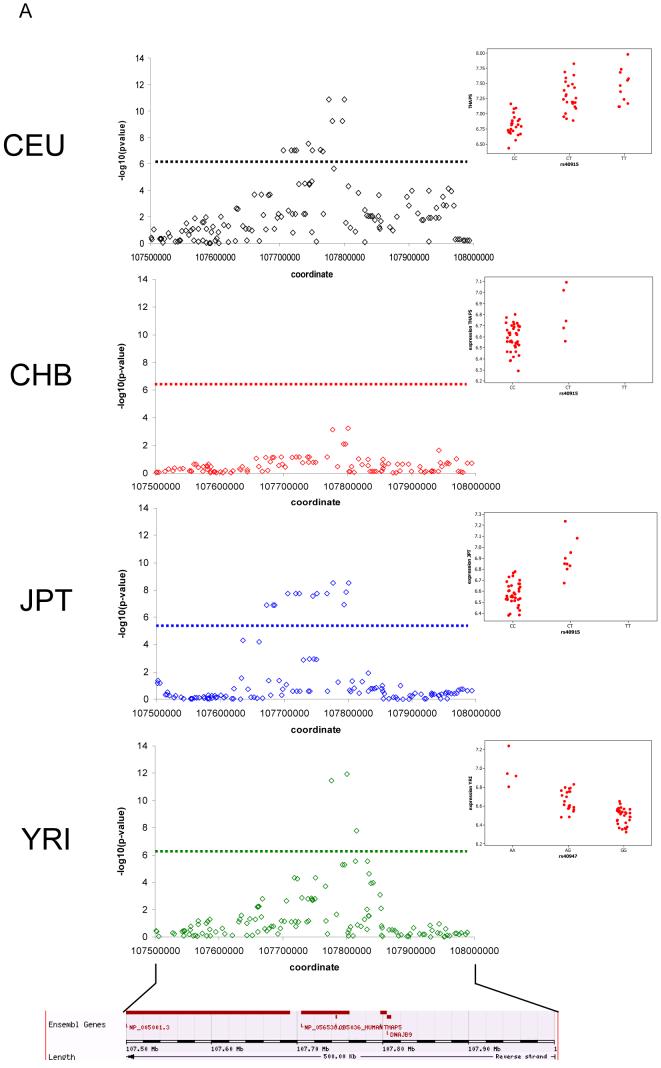
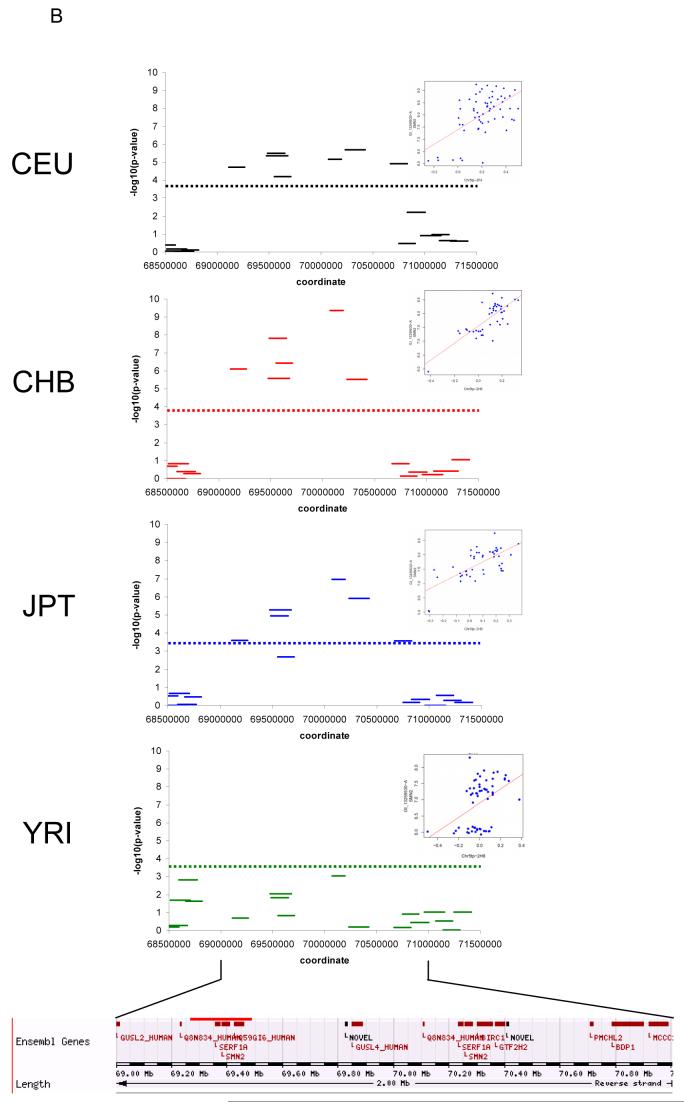
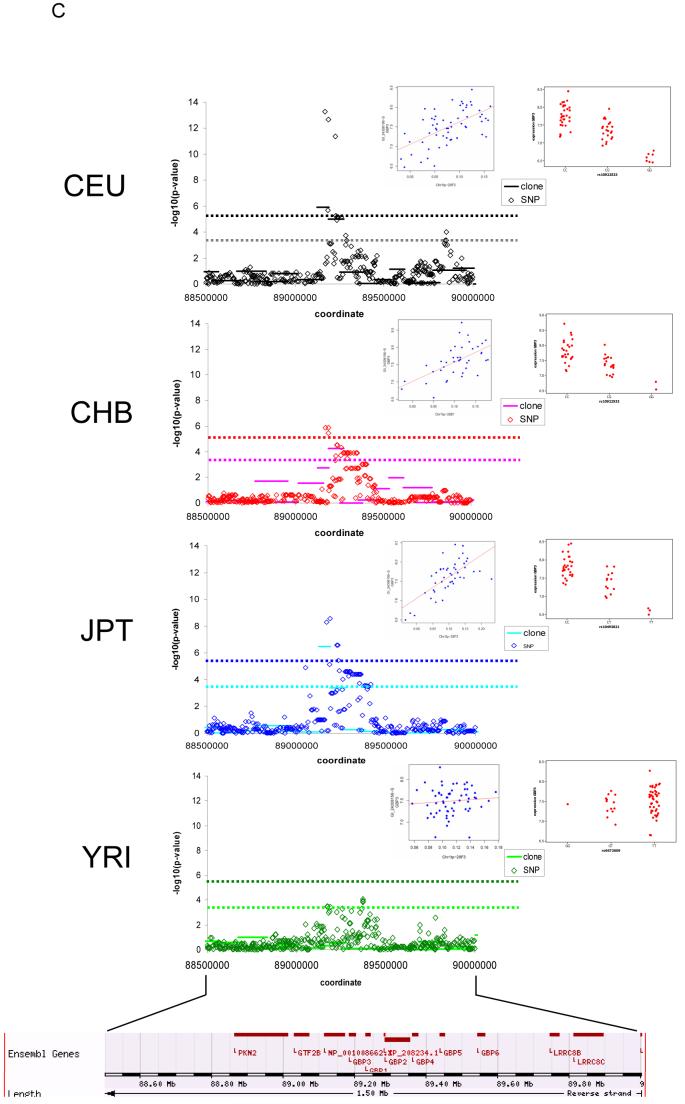
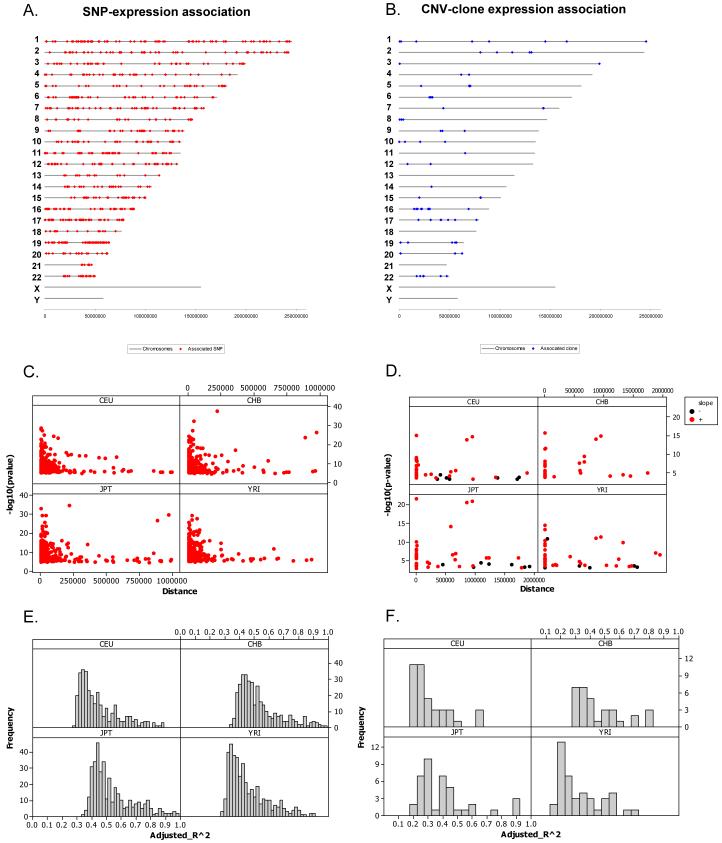
Extensive studies are currently being performed to associate disease susceptibility with one form of genetic variation, namely, single-nucleotide polymorphisms (SNPs). In recent years, another type of common genetic variation has been characterized, namely, structural variation, including copy number variants (CNVs). To determine the overall contribution of CNVs to complex phenotypes, we have performed association analyses of expression levels of 14,925 transcripts with SNPs and CNVs in individuals who are part of the International HapMap project. SNPs and CNVs captured 83.6% and 17.7% of the total detected genetic variation in gene expression, respectively, but the signals from the two types of variation had little overlap. Interrogation of the genome for both types of variants may be an effective way to elucidate the causes of complex phenotypes and disease in humans.


Figures

Figure 1
Figure 1
Examples of SNP-expression and clone-expression associations in the four HapMap populations. A. SNP-expression association for THAP5; chr7. Significant associations between SNPs and expression are observed in CEU, JPT, and YRI, but not in CHB. B. clone-expression association for SMN2; chr5. Significant associations between clones and expression are observed in CEU, CHB, and JPT, but not in YRI. C. SNP-expression and clone-expression association for GBP3; chr1. Both SNPs and clones are significantly associated with expression of GBP3 in CEU, CHB, and JPT, but not in YRI. In each plot, dotted lines show the 0.001 permutation significance threshold. For clone-expression associations, all clones in the window are shown, however the significance threshold was determined by permuting data only from those clones in CNVs where the CNV was present in at least two HapMap individuals. All coordinates shown are from Build 35 of the human genome. Inset panels show the relationship between mRNA levels and SNP genotypes or clone log2 ratios, for the most significant clone or SNP in that population, which may differ across populations.
Figure 1
Figure 1
Examples of SNP-expression and clone-expression associations in the four HapMap populations. A. SNP-expression association for THAP5; chr7. Significant associations between SNPs and expression are observed in CEU, JPT, and YRI, but not in CHB. B. clone-expression association for SMN2; chr5. Significant associations between clones and expression are observed in CEU, CHB, and JPT, but not in YRI. C. SNP-expression and clone-expression association for GBP3; chr1. Both SNPs and clones are significantly associated with expression of GBP3 in CEU, CHB, and JPT, but not in YRI. In each plot, dotted lines show the 0.001 permutation significance threshold. For clone-expression associations, all clones in the window are shown, however the significance threshold was determined by permuting data only from those clones in CNVs where the CNV was present in at least two HapMap individuals. All coordinates shown are from Build 35 of the human genome. Inset panels show the relationship between mRNA levels and SNP genotypes or clone log2 ratios, for the most significant clone or SNP in that population, which may differ across populations.
Figure 2
Figure 2
Genomic location of significant cis-associations for A. SNP-expression associations and B. CNV clone-expression associations. Strength of association as a function of distance between C. SNP and probe and D. CNV and probe. Positive associations between mRNA levels and clone log2 ratios are shown in red, negative associations in black. Distance equal to zero corresponds to the probe residing within the CNV. In each population panel, only the details for the most significant association per significant gene are shown. Distribution of r2 values for the most significant association per significant gene for E. SNP-expression associations and F. clone-expression associations.

References

    1. Stranger BE, et al. PLoS Genet. 2005 Dec;1:e78. - PMC - PubMed
    1. Cheung VG, et al. Nature. 2005 Oct 27;437:1365. - PMC - PubMed
    1. Doss S, Schadt EE, Drake TA, Lusis AJ. Genome Res. 2005 May;15:681. - PMC - PubMed
    1. Brem RB, Kruglyak L. Proc Natl Acad Sci U S A. 2005 Feb 1;102:1572. - PMC - PubMed
    1. Storey JD, Akey JM, Kruglyak L. PLoS Biol. 2005 Aug;3:e267. - PMC - PubMed

Publication types