. 2007 Jun;36(6):688-96.
doi: 10.1165/rcmb.2006-0347OC. Epub 2007 Feb 8.

Chloride-dependent secretion of alveolar wall liquid determined by optical-sectioning microscopy

Affiliations

Chloride-dependent secretion of alveolar wall liquid determined by optical-sectioning microscopy

Jens Lindert et al. Am J Respir Cell Mol Biol. 2007 Jun.

Abstract

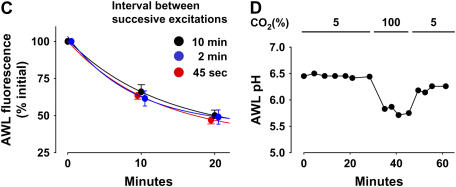
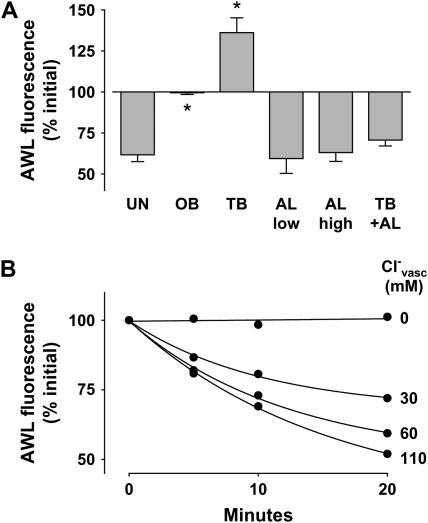
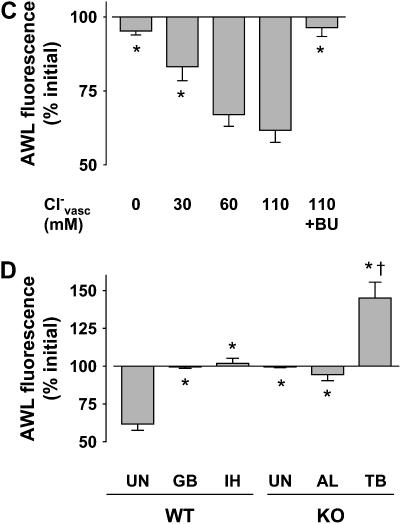
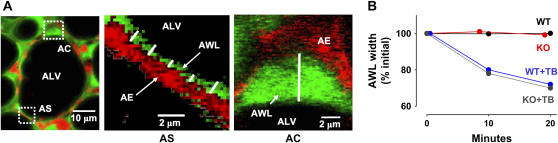
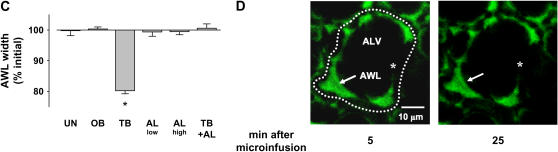
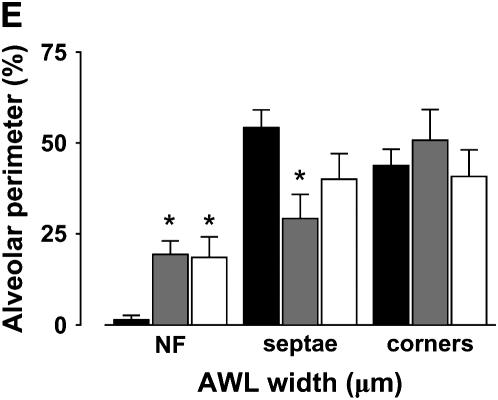
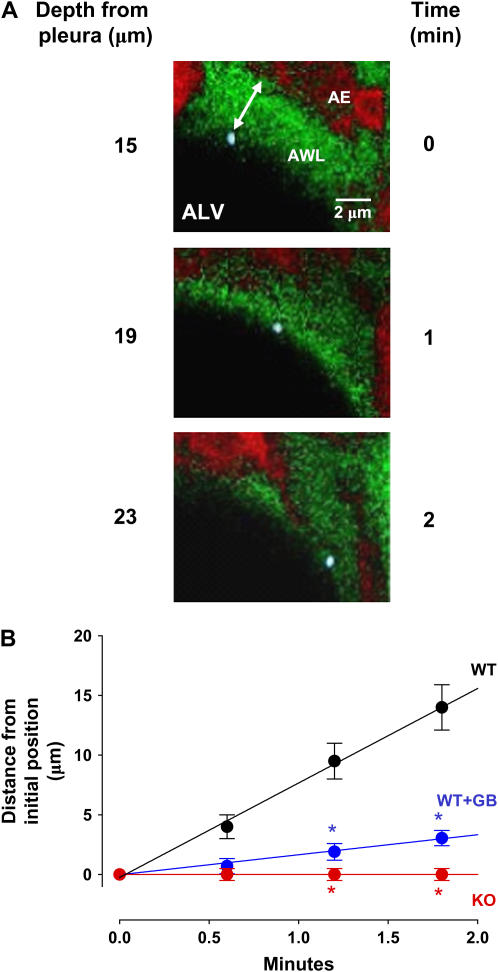
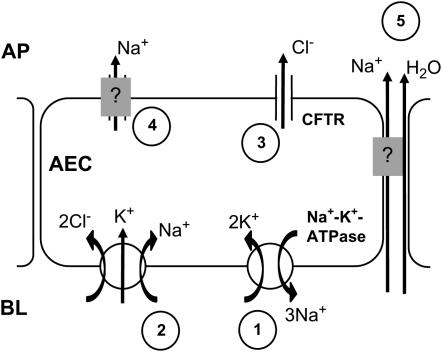
The liquid layer lining the pulmonary alveolar wall critically determines the lung's immune defense against inhaled pathogens, because it provides a liquid milieu in the air-filled alveolus for dispersal of immune cells and defensive surfactant proteins. However, mechanisms underlying formation of the liquid are unknown. We achieved visualization of the alveolar wall liquid (AWL) in situ in mouse lungs by means of optical-sectioning microscopy. Continuous liquid secretion was present in alveoli of wild-type (WT) mice under baseline conditions. This secretion was blocked by inhibitors of the cystic fibrosis transmembrane regulator (CFTR). The secretion was absent in Cftr(-/-) mice, and it was blocked when chloride was depleted from the perfusate of WT mice, providing the first evidence that CFTR-dependent chloride secretion causes AWL formation. Injected microparticles demonstrated flow of the AWL. The flow was blocked by CFTR inhibition and was absent in Cftr(-/-) mice. We conclude that CFTR-dependent liquid secretion is present in alveoli of the adult mouse. Defective alveolar secretion might impair alveolar immune defense and promote alveolar disease.


Figures

<b>Figure 1.</b>
Figure 1.
Gel chromatography. Fraction number, numerical order of samples collected off a Sephadex column (molecular exclusion, > 5 kD). Chromatography responses for FITC (red dots) and FITC-dextran (black dots) are indicated. For FITC-dextran (20 kD) void volume samples were collected in the first 15 fractions. Fraction volumes were 200 μl. Replicated three times each.
<b>Figure 2.</b>
Figure 2.
Calibration of length quantification by optical sectioning microscopy. A shows magnified region of an alveolar wall (AE). The image was taken as a 2-μm optical section 15 μm below the visceral pleura. Pseudocolors show fluorescence of beads (green) of different sizes, and of calcein red–loaded alveolar epithelial cells (red). (B) Diameters for three nominal bead sizes are plotted for data quantified in the alveolus against that in vitro. Mean ± SE, n = 10 for each group. Line drawn by linear regression (P < 0.05).
<b>Figure 3.</b>
Figure 3.
Confocal microscopy of fluorescent AWL tracers introduced by alveolar microinfusion. Images are of 2-μm optical sections of single mouse alveoli at a depth of 20 μm below the visceral pleura. The alveolar lumen (ALV), a septum (thin arrow), and an alveolar corner (double arrows) are marked. (A) Alveolar images show protocol of fluorophore loading by alveolar microinfusion. Left, red fluorescence indicates intracellular fluorescence of calcein red in alveolar epithelium before microinfusion. Middle, image taken 5 min after alveolar microinfusion of FITC-dextran shows green fluorescence along the alveolar epithelial wall, indicating fluorescence loading in the AWL. Note thicker AWL width at alveolar corner. AWL fluorescence is also evident in an adjacent alveolus (thick arrow). Right, image taken 25 min after FITC-dextran loading shows diminished green fluorescence both along the alveolar epithelial wall and at the alveolar corner. (B) Time-dependent changes of AWL fluorescence. For FITC-dextran (black) and FITC-dextran in the presence of ouabain (red), lines were drawn by exponential regression of mean AWL fluorescence against time. P < 0.05. Mean ± SE; n = 5 each group.
<b>Figure 4.</b>
Figure 4.
Methodological considerations. Images are of 2-μm optical sections of a single mouse alveolus at a depth of 20 μm below the visceral pleura. Lumens of the alveolus (ALV) and capillaries (*), a septum (arrow), and an alveolar corner (double arrows) are marked. (A) Red pseudocolor shows calcein fluorescence in capillary endothelial cells. Images were taken during sequential vascular perfusion with nonfluorescent buffer (left), FITC-dextran (green fluorescence, middle), then buffer again (right). The images were taken in each perfusion period at the indicated times after start of perfusion. Note: vascular infusions of FITC-dextran, then buffer, leave no residual alveolar fluorescence (right). (B) Red pseudocolor shows calcein fluorescence in alveolar epithelium. Left image was taken immediately after FITC-dextran (green) microfusion. Right image was taken 20 min later, after intra-alveolar buffer microinfusion. (C) Effect of varying image acquisition rate on time-dependent changes of AWL fluorescence. Data are from imaging series obtained at the indicated intervals between successive image acquisitions. Lines were drawn by exponential regression of mean AWL fluorescence against time. P < 0.05. Mean ± SE; n = 3 each group. (D) Plot from single experiment shows AWL pH during AWL fluorescence decay. Lungs were inflated with indicated concentrations of CO2. Note: pH decreases only in the presence of high CO2. Repeated four times.
<b>Figure 5.</b>
Figure 5.
Effect of inhibitors on alveolar wall liquid (AWL) dynamics. UN, untreated; OB, ouabain (1 mM); TB, terbutaline (2 μM); AL, amiloride (low: 10 μM, high: 2 mM); GB, glibenclamide (0.1 mM); IH, CFTRinh-172 (20 μM); BU, bumetanide (10 μM); WT, wild-type mouse; KO, Cftr−/− mouse. Group bars show data obtained in the first 10 min of imaging. Mean ± SE. n = 4 for each group. (A, D) Data show effects of inhibitors. *P < 0.05 compared with untreated WT. P < 0.05 compared with untreated KO. (B, C) Data show effects of vascular perfusions with buffer solutions containing Cl- at the indicated concentrations (Cl-vasc). P < 0.05 compared with Cl-vasc of 110.
<b>Figure 6.</b>
Figure 6.
Width of alveolar wall liquid (AWL). UN, untreated; TB, terbutaline (2 μM); AL, amiloride (low: 10 μM, high: 2 mM); IH, CFTRinh-172 (20 μM); WT, wild-type mouse; KO, Cftr−/− mouse. (A) Images of a single alveolus (left), taken in a 2-μm optical section at a depth of 20 μm below the pleura, are shown at high magnification (rectangles) for indicated locations at the alveolar septum (AS) and an alveolar corner (AC). Red pseudocolor shows intracellular fluorescence of calcein red in alveolar epithelium (AE). Green pseudocolor shows FITC-dextran in the AWL (AWL). White lines indicate placement of the line quantification tool for AWL width determinations. At the alveolar corner, we determined the maximum AWL width. (B) Plots from single experiments show time course of AWL width changes determined in alveolar corners, for the conditions indicated. (C) Group data show changes in AWL width changes determined in alveolar corners, 10 min after beginning of alveolar imaging. Mean ± SE. n = 4 for each group. *P < 0.05 compared with untreated. (D) Images show a single alveolus of a Cftr−/− mouse at time points after FITC-dextran loading by alveolar microinfusion. The dotted line shows the alveolar margin. Optical sections of 5 μm thickness were taken at 20 μm below the pleura. Uneven AWL distribution is indicated by fluorescence accumulations at corners (arrows), but absence of fluorescence in the marked segment of the alveolar epithelial wall (stars). Note that AWL fluorescence is unchanged between the two images (arrows). (E) Bars show frequency of distribution of AWL width. Widths were determined at 2-μm intervals along the alveolar perimeter (60–80 determinations). NF, no fluorescence; Septae, flat regions of alveolar wall; corners, septal junctions. Mean ± SE, n = 3 alveoli, *P < 0.05 compared with WT. Solid bars, WT; shaded bars, KO; open bars, WT + IH.
<b>Figure 7.</b>
Figure 7.
Convective flow in the AWL. (A) Composite of sequential x-y images taken in a 2-μm optical section at indicated depth and time. ALV, alveolar lumen. Calcein-red fluorescence of alveolar epithelium (AE) is shown in red pseudocolor; green pseudocolor indicates FITC-dextran in the AWL. Microinfused bead (blue, diameter 0.8 μm) on the AWL surface is separated from the alveolar epithelium (double-headed arrow). (B) Distance–time relation of single-bead movement in wild-type (WT), Cftr−/− (KO), and glibenclamide-treated wild-type (WT+GB) alveoli. Lines drawn by linear regression with coefficient of determination of 0.99 (P < 0.05). *P < 0.05 compared with WT. Mean ± SE, and n = 5 for each point.
<b>Figure 8.</b>
Figure 8.
Mechanisms of AWL secretion. AEC, alveolar epithelial cell; BL, baso-lateral; AP, apical. Arrows indicate ion movement. Numbers are sequence of proposed events, namely the basolateral Na+-K+-ATPase establishes an outward Na+ gradient across the cell membrane (1) that drives the basolateral Na+-K+-Cl- cotransporter (2), increasing cytosolic Cl-. Apical CFTR facilitate outward Cl- transport (3) down the Cl- potential gradient. Outward Na+ transport via transcellular (4) or paracellular (5) pathways maintains apical electroneutrality. Water follows passively (5).

References

    1. Clements JA. Lung surfactant: a personal perspective. Annu Rev Physiol 1997;59:1–21. - PubMed
    1. Wright JR. Immunomodulatory functions of surfactant. Physiol Rev 1997;77:931–962. - PubMed
    1. Matthay MA, Folkesson HG, Clerici C. Lung epithelial fluid transport and the resolution of pulmonary edema. Physiol Rev 2002;82:569–600. - PubMed
    1. Gil J, Weibel ER. Improvements in demonstration of lining layer of lung alveoli by electron microscopy. Respir Physiol 1969;8:13–36. - PubMed
    1. Bachofen H, Schurch S. Alveolar surface forces and lung architecture. Comp Biochem Physiol A Mol Integr Physiol 2001;129:183–193. - PubMed

Publication types

MeSH terms