

Impaired DNA damage checkpoint response in MIF-deficient mice
- PMID: 17290223
- PMCID: PMC1852846
- DOI: 10.1038/sj.emboj.7601564
Impaired DNA damage checkpoint response in MIF-deficient mice
Abstract
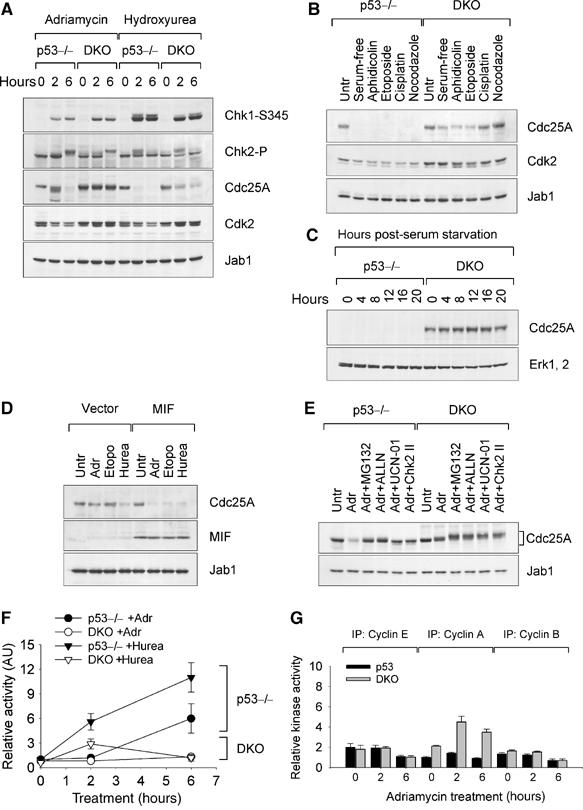
Recent studies demonstrated that proinflammatory migration inhibitory factor(MIF) blocks p53-dependent apoptosis and interferes with the tumor suppressor activity of p53. To explore the mechanism underlying this MIF-p53 relationship, we studied spontaneous tumorigenesis in genetically matched p53-/- and MIF-/-p53-/- mice. We show that the loss of MIF expression aggravates the tumor-prone phenotype of p53-/- mice and predisposes them to a broader tumor spectrum, including B-cell lymphomas and carcinomas. Impaired DNA damage response is at the root of tumor predisposition of MIF-/-p53-/- mice. We provide evidence that MIF plays a role in regulating the activity of Cul1-containing SCF ubiquitin ligases. The loss of MIF expression uncouples Chk1/Chk2-responsive DNA damage checkpoints from SCF-dependent degradation of key cell-cycle regulators such as Cdc25A, E2F1 and DP1, creating conditions for the genetic instability of cells. These MIF effects depend on its association with the Jab1/CSN5 subunit of the COP9/CSN signalosome. Given that CSN plays a central role in the assembly of SCF complexes in vivo, regulation of Jab1/CSN5 by MIF is required to sustain optimal composition and function of the SCF complex.
Figures


Similar articles
-
Structural characterization of As-MIF and hJAB1 during the inhibition of cell-cycle regulation.BMB Rep. 2017 May;50(5):269-274. doi: 10.5483/bmbrep.2017.50.5.201. BMB Rep. 2017. PMID: 28366190 Free PMC article.
-
Macrophage migration inhibitory factor (MIF) promotes cell survival by activation of the Akt pathway and role for CSN5/JAB1 in the control of autocrine MIF activity.Oncogene. 2007 Aug 2;26(35):5046-59. doi: 10.1038/sj.onc.1210318. Epub 2007 Feb 19. Oncogene. 2007. PMID: 17310986
-
Rapid and transient activation of the ERK MAPK signalling pathway by macrophage migration inhibitory factor (MIF) and dependence on JAB1/CSN5 and Src kinase activity.Cell Signal. 2006 May;18(5):688-703. doi: 10.1016/j.cellsig.2005.06.013. Epub 2005 Aug 24. Cell Signal. 2006. PMID: 16122907
-
Macrophage migration inhibitory factor coordinates DNA damage response with the proteasomal control of the cell cycle.Cell Cycle. 2007 May 2;6(9):1030-4. doi: 10.4161/cc.6.9.4163. Epub 2007 May 20. Cell Cycle. 2007. PMID: 17426455 Review.
-
Emerging roles of Jab1/CSN5 in DNA damage response, DNA repair, and cancer.Cancer Biol Ther. 2014 Mar 1;15(3):256-62. doi: 10.4161/cbt.27823. Epub 2014 Feb 4. Cancer Biol Ther. 2014. PMID: 24495954 Free PMC article. Review.
Cited by
-
Role of macrophage migration inhibitory factor in age-related lung disease.Am J Physiol Lung Cell Mol Physiol. 2015 Jul 1;309(1):L1-10. doi: 10.1152/ajplung.00339.2014. Epub 2015 May 8. Am J Physiol Lung Cell Mol Physiol. 2015. PMID: 25957294 Free PMC article. Review.
-
Transcription factor ICBP90 regulates the MIF promoter and immune susceptibility locus.J Clin Invest. 2016 Feb;126(2):732-44. doi: 10.1172/JCI81937. Epub 2016 Jan 11. J Clin Invest. 2016. PMID: 26752645 Free PMC article.
-
Mechanisms of macrophage migration inhibitory factor (MIF)-dependent tumor microenvironmental adaptation.Exp Mol Pathol. 2009 Jun;86(3):180-5. doi: 10.1016/j.yexmp.2009.01.001. Epub 2009 Jan 7. Exp Mol Pathol. 2009. PMID: 19186177 Free PMC article. Review.
-
Targeting Jab1/CSN5 in nasopharyngeal carcinoma.Cancer Lett. 2012 Dec 30;326(2):155-60. doi: 10.1016/j.canlet.2012.07.033. Epub 2012 Aug 4. Cancer Lett. 2012. PMID: 22867945 Free PMC article. Review.
-
Improved survival of mesenchymal stem cells by macrophage migration inhibitory factor.Mol Cell Biochem. 2015 Jun;404(1-2):11-24. doi: 10.1007/s11010-015-2361-y. Epub 2015 Feb 21. Mol Cell Biochem. 2015. PMID: 25701358 Free PMC article.
References
-
- Bartek J, Lukas J (2003) Chk1 and Chk2 kinases in checkpoint control and cancer. Cancer Cell 3: 421–429 - PubMed
-
- Bartek J, Lukas C, Lukas J (2004) Checking on DNA damage in S phase. Nat Rev Mol Cell Biol 5: 792–804 - PubMed
-
- Bassing CH, Alt FW (2004) The cellular response to general and programmed DNA double strand breaks. DNA Repair (Amst) 3: 781–796 - PubMed
Publication types
MeSH terms
Substances
LinkOut - more resources
Full Text Sources
Molecular Biology Databases
Research Materials
Miscellaneous
