Comparative Study
. 2007 Feb;8(2):477-84.
doi: 10.1021/bm0605863.

Mechanistic differences in DNA nanoparticle formation in the presence of oligolysines and poly-L-lysine

Affiliations
Comparative Study

Mechanistic differences in DNA nanoparticle formation in the presence of oligolysines and poly-L-lysine

Irina Nayvelt et al. Biomacromolecules. 2007 Feb.

Abstract

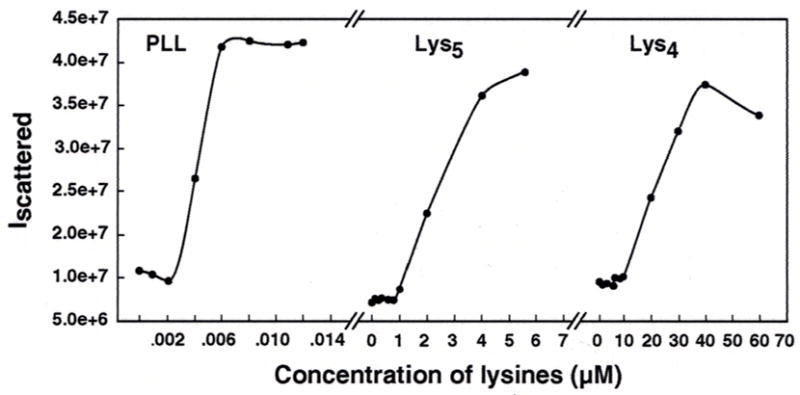
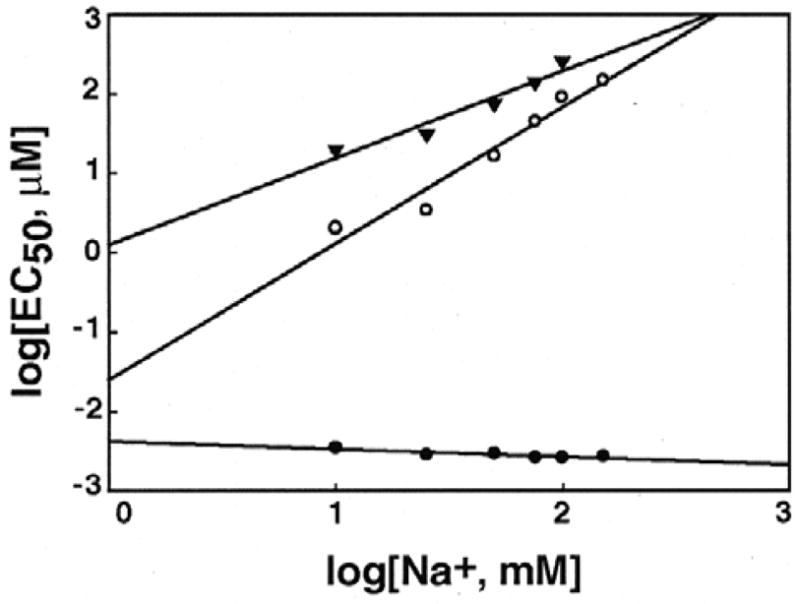
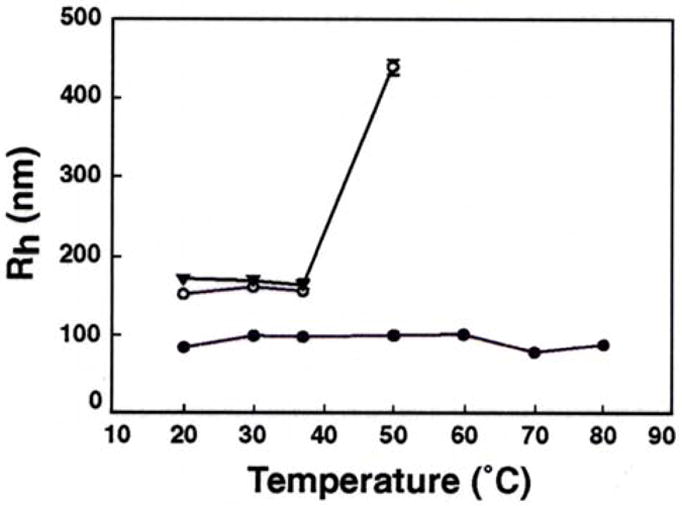
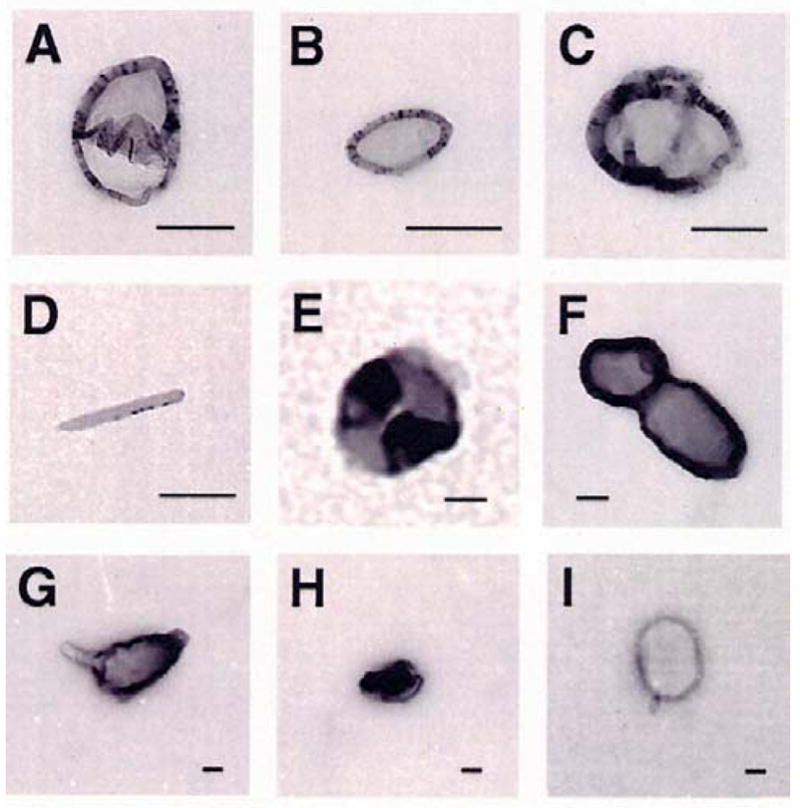
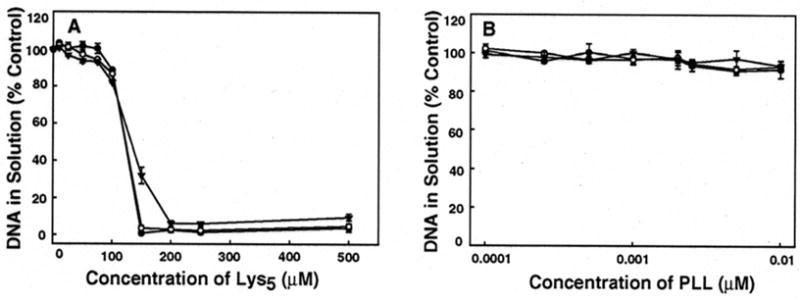
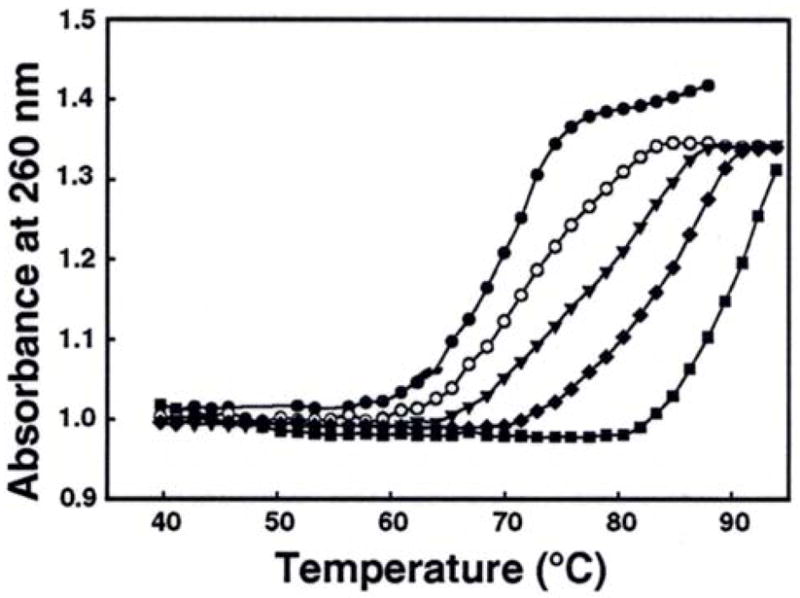
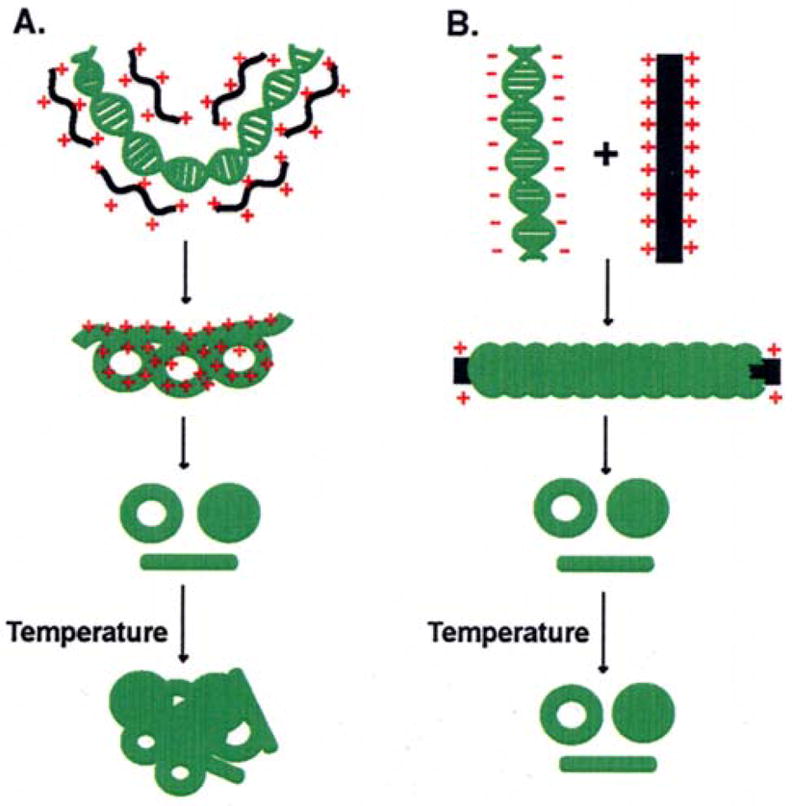
We studied the effectiveness of trilysine (Lys3), tetralysine (Lys4), pentalysine (Lys5), and poly-l-lysine (PLL) (MW 50000) on lambda-DNA nanoparticle formation and characterized the size, shape, and stability of nanoparticles. Light scattering experiments showed EC50 (lysine concentration at 50% DNA compaction) values of approximately 0.0036, 2, and 20 micromol/L, respectively, for PLL, Lys5, and Lys4 at 10 mM [Na+]. Plots of log EC50 versus log [Na+] showed positive slopes of 1.09 and 1.7, respectively, for Lys4 and Lys5 and a negative slope of -0.1 for PLL. Hydrodynamic radii of oligolysine condensed particles increased (48-173 nm) with increasing [Na+], whereas no significant change occurred to nanoparticles formed with PLL. There was an increase in the size of nanoparticles formed with Lys5 at >40 degrees C, whereas no such change occurred with PLL. The DNA melting temperature increased with oligolysine concentration. These results indicate distinct differences in the mechanism(s) by which oligolysines and PLL provoke DNA condensation to nanoparticles.


Figures

Figure 1
Figure 1
Typical plots of relative intensity of scattered light at 90° against concentrations of Lys4, Lys5, and PLL. The λ-DNA solution had a concentration of 1.5 μM DNA phosphate, dissolved in 10 mM Na cacodylate buffer, pH 7.4. Lysine concentrations are in terms of the whole molecules, μmoles/liter.
Figure 2
Figure 2
Effect of Na+ concentration on the midpoint condensing concentration (EC50) of Lys4, Lys5 and poly-L-lysine. The log of EC50 (μmoles/liter) is plotted against log of [Na+] (mM). The symbols represent EC50 values of Lys4 (▾), Lys5 (○), and poly-L-lysine (●). Error bars are of a magnitude to be contained within the symbols, and indicate standard deviation from 3 separate experiments.
Figure 3
Figure 3
Effect of temperature on hydrodynamic radius (Rh) of λ-DNA nanoparticles. The symbols represent mean Rh values of nanoparticles produced in 100 mM Na cacodylate buffer in the presence of Lys4 (▼), Lys5 (○), and poly-L-lysine (●). Error bars indicate standard deviation from 4–6 separate experiments and are generally of a magnitude to be contained within the symbol.
Figure 4
Figure 4
Representative electron micrographs of λ-DNA nanoparticles produced by Lys5, and poly-L-lysine. Experiments were conducted in Na cacodylate buffer, containing different concentrations of NaCl. A and B, Lys5 induced particles in 50 mM [Na+]; C, Lys5 in 10 mM [Na+]; D and E, Lys5 in 100 mM [Na+]; F, poly-L-lysine in 10 mM [Na+]; G and H, poly-L-lysine in 50 mM [Na+]; and I, poly-L-lysine in 100 mM [Na+]. It should be noted that the intense darkness of the micrographs is due to uranyl acetate staining. The bars in all panels (A-I) represent 100 nm.
Figure 5
Figure 5
Precipitation/aggregation of λ-DNA in the presence of (A) Lys5 and (B) PLL, observed at room temperature (●), 50 °C (○), and 70 °C (▼). All experiments were conducted in 100 mM Na cacodylate buffer (pH 7.4). A logarithmic scale is used for PLL concentrations in panel B. Error bars represent standard deviation from 3 separate experiments. The DNA concentration used in these experiments was 0.1 A260nm units.
Figure 6
Figure 6
Typical melting profiles of λ-DNA in the presence of Lys5. The concentrations of Lys5 were: 0 (●), 1 (○), 2.5 (▼), 5 (◆), and 10 (■) μM. The Tm measurements were conducted in 10 mM Na cacodylate buffer at a heating rate of 0.5 °C/minute.
Figure 7
Figure 7
Schematic representation of 2 different mechanisms in the condensation of λ-DNA by: (A) oligolysines and (B) poly-L-lysine. In A, oligolysines are assumed to bind with DNA by electrostatic forces, leading to the collapse of DNA to nanoparticles. When these particles are heated, oligolysines partially dissociate from DNA, leading to partial melting of DNA and cross-linking of different DNA molecules to aggregates. In B, DNA is modeled to wrap around poly-L-lysine. The wrapped particles are protected from heat-induced denaturation and cross-linking.

Similar articles

Cited by

References

    1. Vijayanathan V, Thomas T, Thomas TJ. Biochemistry. 2002;41:14085. - PubMed
    1. Bloomfield VA. Curr Opin Struct Biol. 1996;6:334. - PubMed
    1. Hud NV, Vilfan ID. Annu Rev Biophys Biomol Struct. 2005;34:295. - PubMed
    1. Gosule LC, Schellman JA. J Mol Biol. 1978;121:311. - PubMed
    1. Widom J, Baldwin RL. J Mol Biol. 1980;144:431. - PubMed

Publication types