Seasonality in six enterically transmitted diseases and ambient temperature
- PMID: 17291363
- PMCID: PMC2870561
- DOI: 10.1017/S0950268806006698
Seasonality in six enterically transmitted diseases and ambient temperature
Abstract
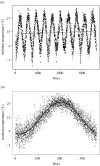
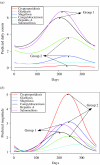
We propose an analytical and conceptual framework for a systematic and comprehensive assessment of disease seasonality to detect changes and to quantify and compare temporal patterns. To demonstrate the proposed technique, we examined seasonal patterns of six enterically transmitted reportable diseases (EDs) in Massachusetts collected over a 10-year period (1992-2001). We quantified the timing and intensity of seasonal peaks of ED incidence and examined the synchronization in timing of these peaks with respect to ambient temperature. All EDs, except hepatitis A, exhibited well-defined seasonal patterns which clustered into two groups. The peak in daily incidence of Campylobacter and Salmonella closely followed the peak in ambient temperature with the lag of 2-14 days. Cryptosporidium, Shigella, and Giardia exhibited significant delays relative to the peak in temperature (approximately 40 days, P<0.02). The proposed approach provides a detailed quantification of seasonality that enabled us to detect significant differences in the seasonal peaks of enteric infections which would have been lost in an analysis using monthly or weekly cumulative information. This highly relevant to disease surveillance approach can be used to generate and test hypotheses related to disease seasonality and potential routes of transmission with respect to environmental factors.
Figures


References
-
- Amin OM. Seasonal prevalence of intestinal parasites in the United States during 2000. American Journal of Tropical Medicine and Hygiene. 2002;66:799–803. - PubMed
-
- Barwick RS. et al. Surveillance for waterborne-disease outbreaks – United States, 1997–1998. MMWR. CDC Surveillance Summaries. 2000;49:1–21. - PubMed
-
- Bean NH. et al. Surveillance for foodborne-disease outbreaks – United States, 1988–1992. MMWR. CDC Surveillance Summaries. 1996;45:1–66. - PubMed
-
- Bowman C, Flint J, Pollari F. Canadian integrated surveillance report: Salmonella, Campylobacter, pathogenic E. coli and Shigella, from 1996 to 1999. Canadian Communicable Disease Report. 2003;29:1–6. (Suppl. 1): - PubMed
-
- Lee SH. et al. Surveillance for waterborne-disease outbreaks – United States, 1999–2000. MMWR. CDC Surveillance Summaries. 2002;51:1–47. - PubMed

