. 2007 May;28(3):613-21.
doi: 10.1016/j.neuro.2007.01.001. Epub 2007 Jan 13.

Characterization of methyl-beta-cyclodextrin toxicity in NGF-differentiated PC12 cell death

Affiliations

Characterization of methyl-beta-cyclodextrin toxicity in NGF-differentiated PC12 cell death

Joel E Ulloth et al. Neurotoxicology. 2007 May.

Abstract

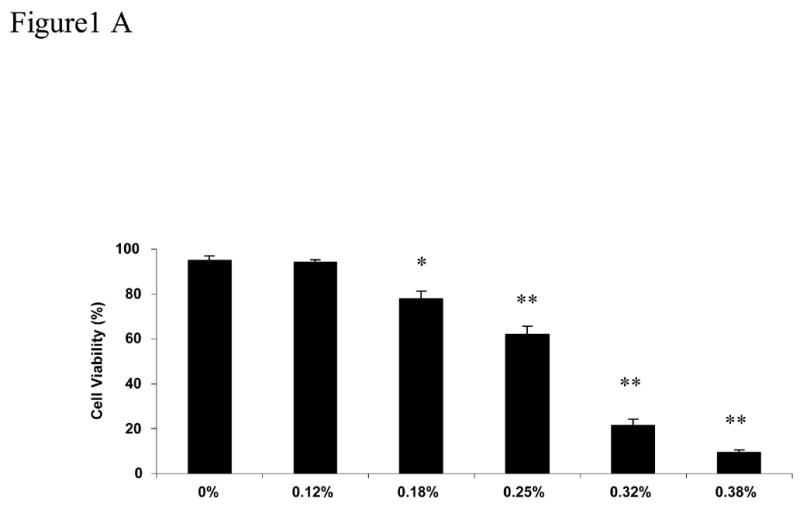
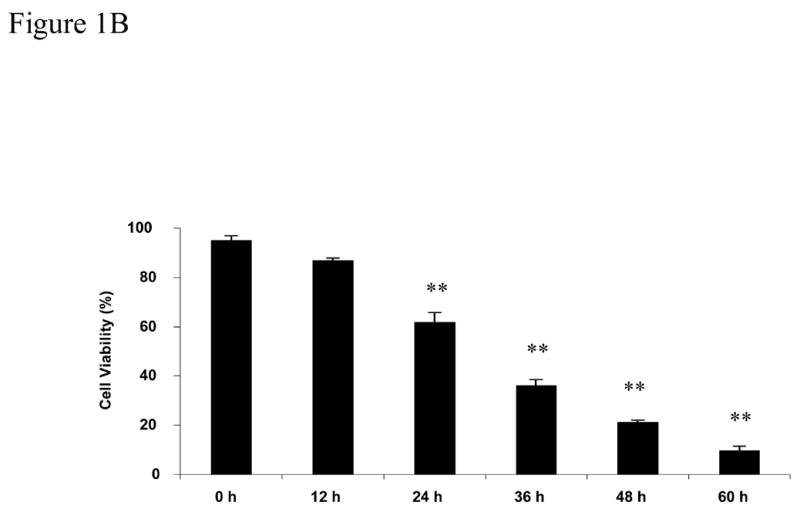
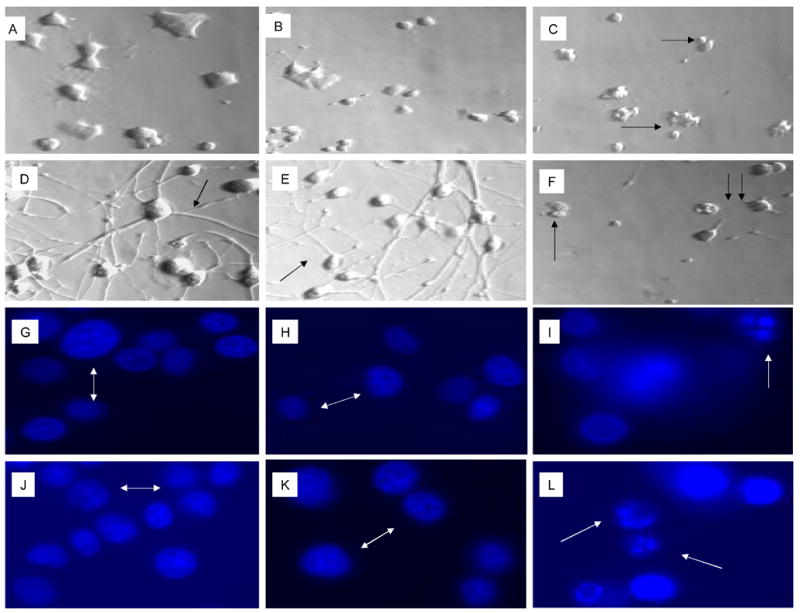
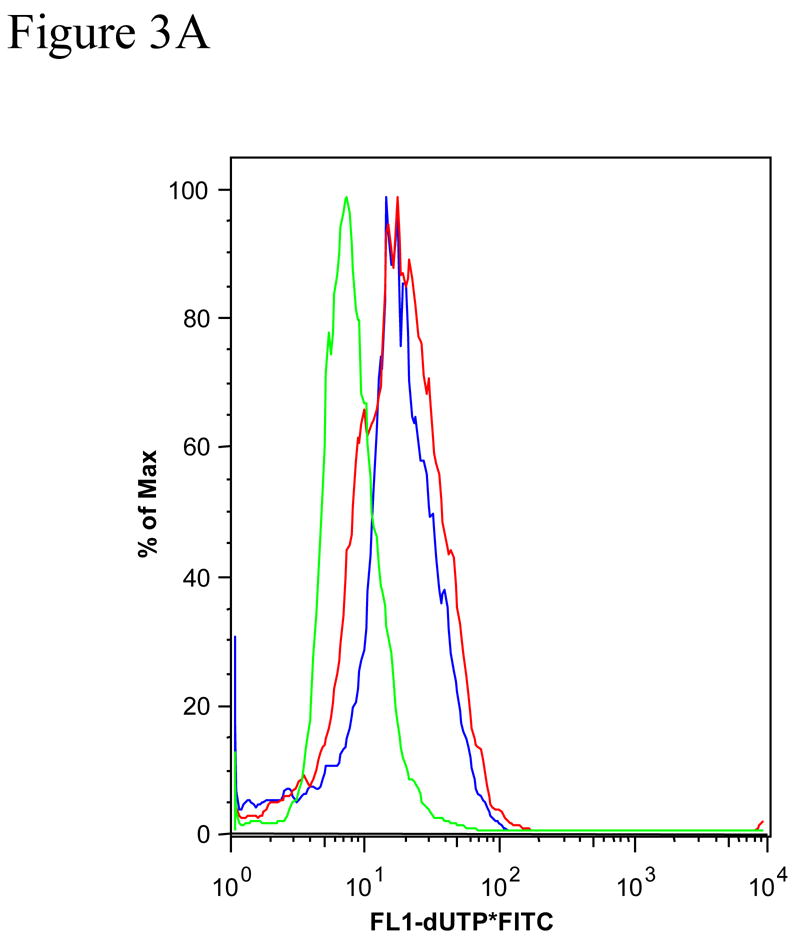
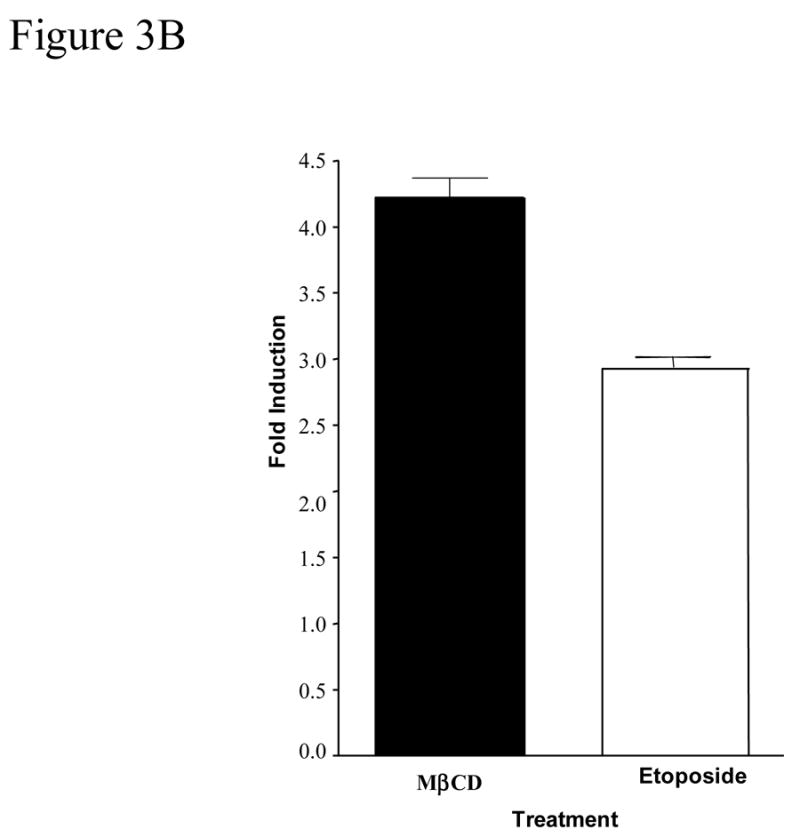
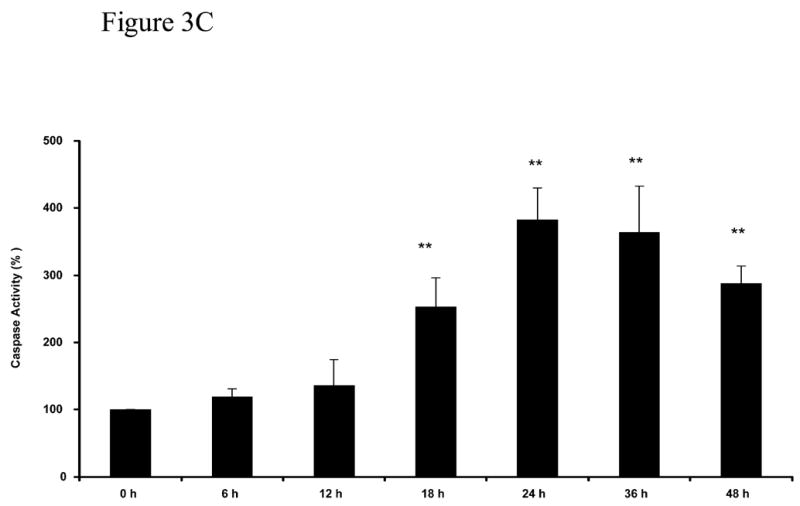
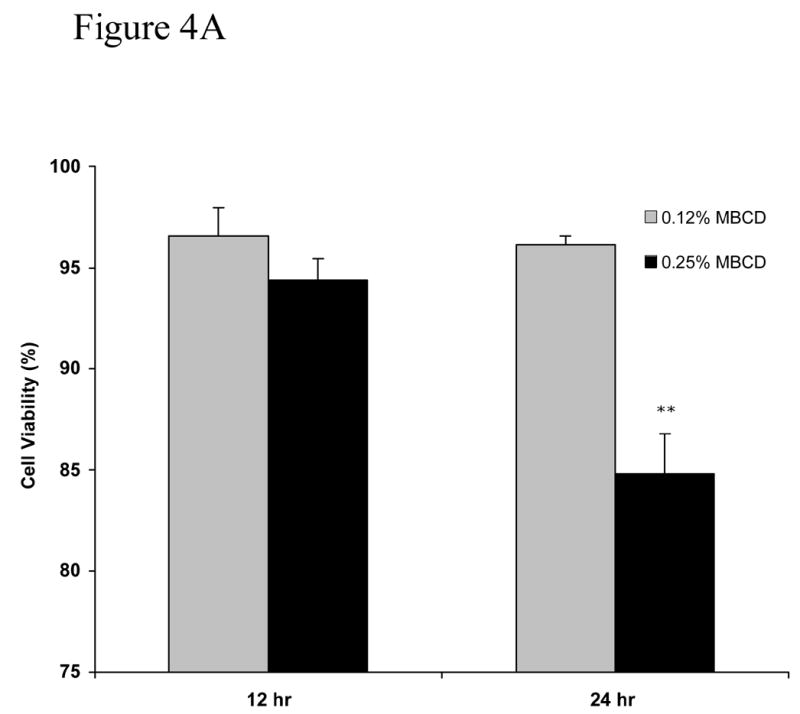
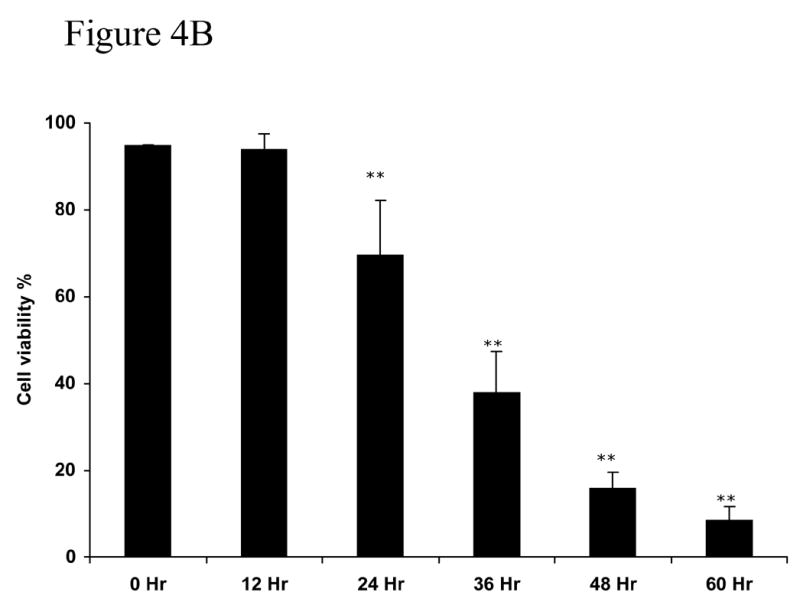
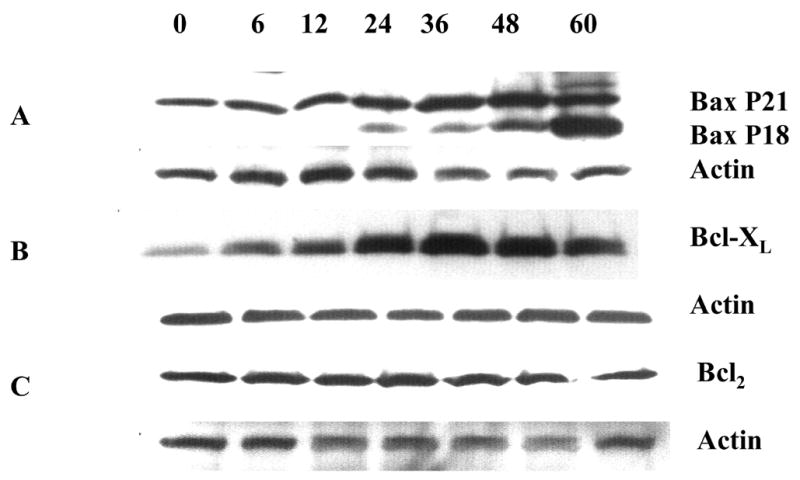
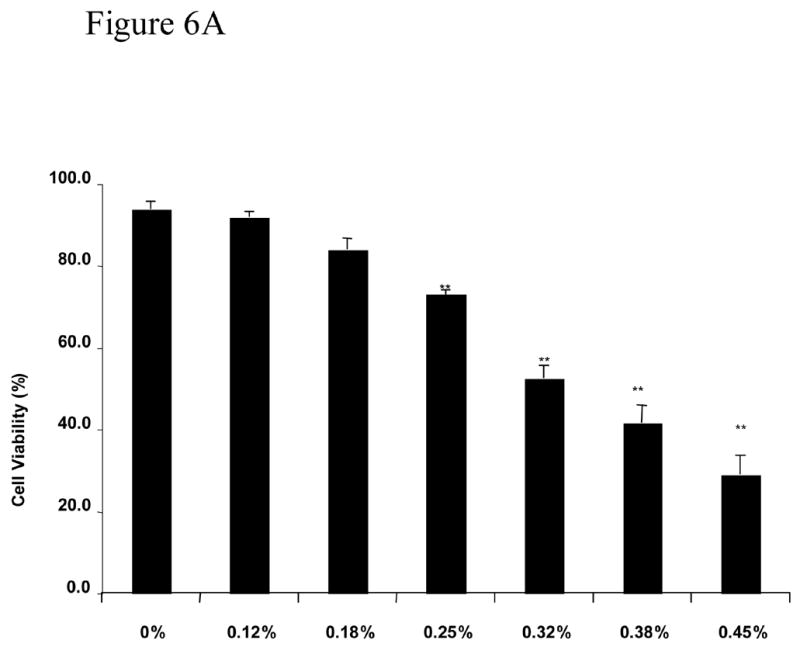
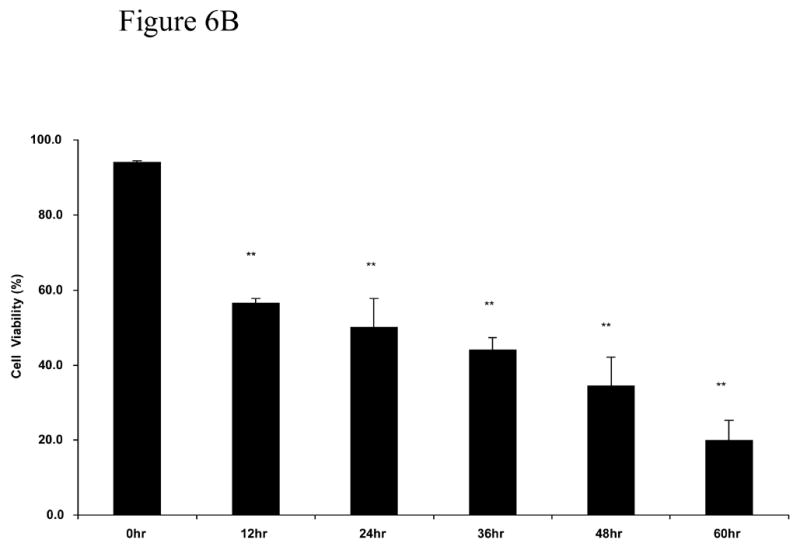
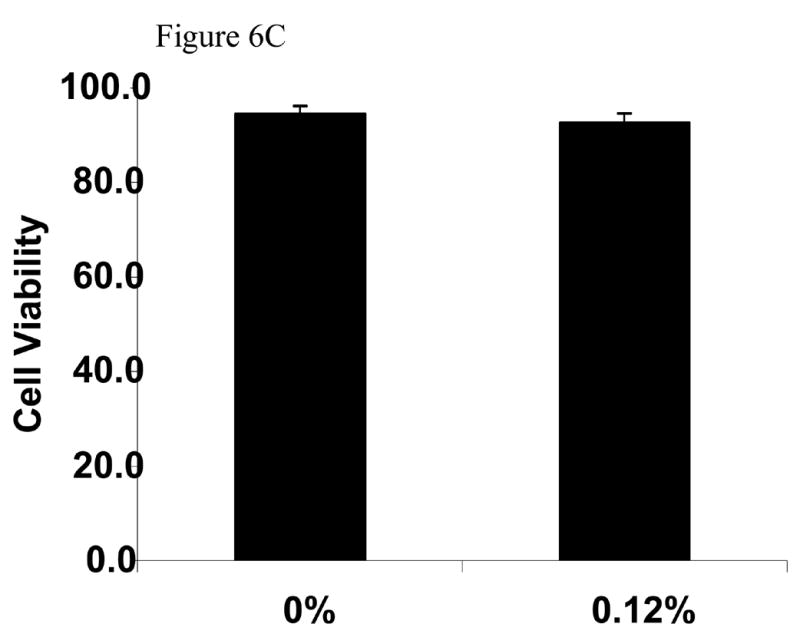
Cyclodextrins (CDs) are used to deliver hydrophobic molecules in aqueous environments. Methyl-beta-cyclodextrin (MbetaCD), a member of this family of molecules, has been proposed to be a good carrier to deliver fatty acids to cells in culture. This report focuses on studying the in vitro effects of MbetaCD on nerve growth factor-differentiated PC12 (NGFDPC12) cells, a tissue culture model to study neuronal survival and differentiation. The main findings are: (1) NGFDPC12 cells have normal viability when exposed to 0.12% MbetaCD but showed a significant loss in cell viability at higher concentrations; (2) NGFDPC12 cells exposed to 0.25% MbetaCD exhibit nuclear condensation, blebbing and apoptotic bodies, and whole cell lysates exhibited an increase in caspase-3-like activity and high levels of Bax and Bcl-X(L) protein expression compared to control. Cultures treated with 0.25% MbetaCD also showed cleavage of normal 21-kDa Bax protein into a 18-kDa fragment. (3) Experiments using 0.12% MbetaCD to deliver oleic acid did not affect cell viability, in contrast NGFDPC12 cultures in which 0.25% MbetaCD concentration is used exhibited similar loss of cell viability as observed with 0.25% MbetaCD alone. Treating these cultures with caspase-3 inhibitor z-VAD-fmk did not protect the cells from MbetaCD toxic effects. (4) Immortalized Schwann cells (iSC) exposed to MbetaCD 0.12% did not show loss of cell viability while 0.25% MbetaCD triggered a significant toxicity but with a different dose and time course dynamic than NGFDPC12 cells. Thus, NGFDPC12 or iSC cell cultures exposed to 0.12% MbetaCD exhibits normal viability while higher concentrations increase in cell death and apoptosis.


Figures

Figure 1
Figure 1. Cell viability of nerve growth factor-differentiated PC12 (NGFDPC12) cells following exposure to different concentrations of MβCD
A: NGFDPC12 cells were exposed to different concentrations of MβCD (shown on the X-axis) for 24 h. Cell viability was assessed using trypan blue exclusion as described in Materials and Methods section. B: NGFDPC12 cell cultures were exposed to 0.25% MβCD for up to 60 hours (h) and cell viability assessed at each time point. Data are represented as the mean ± the standard deviation of the mean (X ± SDM) for two independent experiments performed in duplicate. Each experiment examined at least 1000 cells selected in random fields. Statistical significance was determined as described in Methods. * p<0.05, ** p<0.01.
Figure 2
Figure 2. Cellular and nuclear morphology of naïve PC12 and NGFDPC12 cells treated with 0.12% and 0.25% MβCD
Panels A-F show representative cell morphologies with phase contrast microscopy and panels G-L show representative nuclear morphologies using Hoechst staining with fluorescent microscopy (see Materials and Methods). Naïve PC12 cells were cultured without MβCD (A,G), exposed to 0.12% (B, H) or 0.25% (C, I) MβCD for 72 hours. Similarly, NGFDPC12 cells were cultured without MβCD (D, J), exposed to 0.12% (E, K) or 0.25% (F, L) MβCD for 72 hours.) White double arrows (G, H, J, K) show normal nuclei. White arrows (I, L) indicate apoptotic and fragmented nuclei. Single black arrows (C, F) show fragmented cells. Notice the network of NGFDPC12 cells expressing neurites in D (arrow) and E (arrow) as comparison to F (twin arrows).
Figure 3
Figure 3. Tunnel assay and caspase-3 activity of NGFDPC12 cells exposed to MβCD
The BRDU-tunnel assay was done as described in Materials and Methods. NGFDPC12 cells were exposed for 60 h to 0.25% MβCD, or etoposide, harvested, fixed and analyzed by flow cytometry. A: Chromatogram of NGFDPC12 cells control (green) treated with MβCD (red) or with etoposide (blue). B: Quantification of MβCD and Etoposide apoptotic effect. C: Determination of caspase-3 like activity. Caspase -2, -3, and -7 (DEVDase) activities were measured in cell lysates of NGFDPC12 cells exposed to 0.25% MCD. Caspase activity is represented as the mean ± SDM of three independent experiments. Statistical significance was determined as described in Methods. * p<0.05, ** p<0.01.
Figure 4
Figure 4. Cell viability of NGFDPC12 cells with nontoxic levels of oleic acid using MβCD as carrier with or without caspase-3 inhibitor ZVAD-fnk
A: Viability in cell cultures treated with oleic acid and containing MβCD (0.12% or 0.25%) as carrier in the absence of zVAD-fmk. B: NGFDPC12 cells were treated with oleic acid with 0.25% MβCD in the presence of zVAD-fmk as described in Methods. Cell viability and statistical analysis were done as described in Method section. Each time point represents the mean of three independent experiments (X±SDM). ** p<0.01.
Figure 5
Figure 5. Western blot analysis of Bax, Bcl-XL and Bcl-2 expression in response to exposure to 0.25% MβCD
NGFDPC12 cells were exposed for varying times to 0.25% MβCD, cells harvested, whole cell lysates prepared, and Western blot analysis performed as described in Materials and Methods. We used actin protein in each Western blot as a control for loading and gel transfer. Each blot is representative of at least two independent experiments. A: Bax. B: Bcl-XL. C: Bcl-2.
Figure 6
Figure 6. Viability of Schwann cells cultures exposed to MβCD
A: Concentration dependent effect of MβCD on iSC viability. Cultures were treated with different concentrations of MβCD for 48 hours and process for trypan blue assay. B: Time dependent effect of 0.45% MβCD on iSC viability. C: Determination of viability of iSC cells following exposure to continuous exposure to 0.12%MCD (the sentence before this one is deleted). Cultures were treated for 72 hours and processed for trypan blue assay. Cell viability and statistical analysis were performed as described in Methods Section. Each time point represents the mean of three independent experiments (X±SDM) with a random sampling of at least 1000 cells. Statistical analysis was performed as shown in Methods. ** p<0.01

Similar articles

Cited by

References

    1. Abrami L, van der Goot FG. Plasma membrane microdomains act as concentration platforms to facilitate intoxication of aerolysin. J Cell Biol. 1999;147(1):175–184. - PMC - PubMed
    1. Adams JM, Cory S. The bcl-2 protein family: Arbiters of cell survival. Science. 1998;281:1322–1325. - PubMed
    1. Bar-On P, Rockenstein E, Adame A, Ho G, Hashimoto M, Masliah E. Effect of the cholesterol-lowering compound methyl-β-cyclodextrin in models of -synucleinopathy. 2006;98:1032–1045. - PubMed
    1. Bender ML, Komiyama M. Cyclodextrin Chemistry. Heidelberg: Springer-Verlag; 1978. pp. 10–27.
    1. Bernard DW, Rodriguez A, Rothblat GH, Glick JM. Influence of high density lipoprotein on esterified cholesterol stores in macrophages and hepatoma cells. Arteriosclerosis. 1990;10:135–144. - PubMed

Publication types

MeSH terms