Comparative Study
. 2007 May 15;162(1-2):49-63.
doi: 10.1016/j.jneumeth.2006.12.004. Epub 2006 Dec 20.

Comparison of spectral analysis methods for characterizing brain oscillations

Affiliations
Comparative Study

Comparison of spectral analysis methods for characterizing brain oscillations

Marieke K van Vugt et al. J Neurosci Methods. .

Abstract

Spectral analysis methods are now routinely used in electrophysiological studies of human and animal cognition. Although a wide variety of spectral methods has been used, the ways in which these methods differ are not generally understood. Here we use simulation methods to characterize the similarities and differences between three spectral analysis methods: wavelets, multitapers and P(episode). P(episode) is a novel method that quantifies the fraction of time that oscillations exceed amplitude and duration thresholds. We show that wavelets and P(episode) used side-by-side helps to disentangle length and amplitude of a signal. P(episode) is especially sensitive to fluctuations around its thresholds, puts frequencies on a more equal footing, and is sensitive to long but low-amplitude signals. In contrast, multitaper methods are less sensitive to weak signals, but are very frequency-specific. If frequency specificity is not essential, then wavelets and P(episode) are recommended.


Figures

Fig. 1
Fig. 1. Basic characteristics of the three oscillatory detection methods
Spectrograms (a-c) and spectra (d-f) of a 10 Hz signal of simulated data for wavelets (left), multitapers (middle) and Pepisode (right). In all cases, a signal from 200-800 ms was added to a noisy background, with a frequency of 10 Hz and an amplitude of 5% of the background activity. These spectrograms/spectra show a mean over 100 trials. Technical details of each of the methods are shown in (g-i): a sample wavelet (g), sample multitapers (h) and illustration of the Pepisode method (i).
Fig. 2
Fig. 2. Detection thresholds
Detection threshold of a signal (minimum signal amplitude that can be detected) as a function of signal length in cycles (one cycle has a length of 1/frequency seconds). The amplitude of the signal is expressed as fraction of the amplitude of the background EEG at that frequency (error bars are standard error of the mean).
Fig. 3
Fig. 3. Trade-off between amplitude and length of signals
Increase in normalized response of the oscillation detection method divided by the increase in amplitude. The signal is at 40 Hz and added at three different amplitudes. When this index is near zero, the detection method is not sensitive to amplitude, whereas large values indicate a strong response to amplitude.
Fig. 4
Fig. 4. Frequency specificity
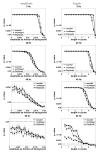
Comparison of frequency specificity for the three signal detection methods at four different frequencies. Each panel shows the p-value for the comparison between signal and no-signal (the dash-dotted line indicates p = 0.05) as a function of frequency. Signals with a length of 500 ms (left column) or 4 cycles (right column) and amplitudes of 1 and 4 % of the background amplitude, respectively, were added. Each point is the average p-value for 50 runs of the analysis. Insets show a close-up for the frequencies 0–10 Hz.
Fig. 5
Fig. 5. The effect of near-threshold populations
To investigate near-threshold signal detection in the three methods, a population of signals with the highest amplitude (left column) and length (right column), respectively, is compared to populations with varying lengths and amplitudes. Lower p-values indicate better detection. Pepisode shows a regime with better detection than the other two methods when the populations get closer to one another (i.e., the graphed amplitude/length comes closer to the maximum amplitude/length). Error bars are standard error of the mean.
Fig. 6
Fig. 6. The effect of amplitude on the detection of a very short signal
A signal of half a cycle is added to the background EEG with varying amplitudes (abscissa). Detection is measured as the p-value of the rank sum test comparing populations of samples with and without signals.
Fig. 7
Fig. 7
Correlations across 2-second trials (for different electrodes) between mean wavelet/multitaper power and Pepisode at different frequencies.
Fig. 8
Fig. 8
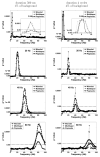
Sample electrodes exhibiting oscillatory subsequent memory effects (first row: hippocampus; second row: LIPC (BA47)). Each panel shows the Z-transformed significance value of the difference in power between recalled and not-recalled words in the time bin 1000-2000 ms after word onset (rank sum test). The sign indicates the direction of the effect, and the gray area indicates the p > 0.05 significance threshold. The wavelet spectra in the left column are replications of Sederberg et al. (in press), Fig. 1(a) and 1(c); middle and right-hand columns show multitaper and Pepisode spectra, respectively, for the same electrode. Notice how the different methods can detect different types of signal.

References

    1. Bastiaansen M, Hagoort P. Event-induced theta responses as a window on the dynamics of memory. Cortex. 2003;39:967–992. - PubMed
    1. Berger H. Übert das Elektroenkephalogramm des menschen (On the human electroencephalogram) Archiv für Psychiatry und Nervenkrankheiten. 1929;87:527–570.
    1. Bronez TP. On the performance advantage of multitaper spectral analysis. IEEE Transactions on Signal Processing. 1992;40(12):2941–2946.
    1. Bruns A. Fourier-, Hilbert- and wavelet-based signal analysis: are they really different approaches? Journal of Neuroscience Methods. 2004;137:321–332. - PubMed
    1. Buzsáki G, Draguhn A. Neuronal oscillations in cortical networks. Science. 2004;304(5679):1926–1929. - PubMed

Publication types

LinkOut - more resources