. 2007 Feb;26(2):191-203.
doi: 10.1016/j.immuni.2006.12.006. Epub 2007 Feb 8.

Unique maturation program of the IgE response in vivo

Affiliations

Unique maturation program of the IgE response in vivo

Agustin Erazo et al. Immunity. 2007 Feb.

Abstract

A key event in the pathogenesis of asthma and allergies is the production of IgE antibodies. We show here that IgE(+) cells were exceptional because they were largely found outside germinal centers and expressed, from very early on, a genetic program of plasma cells. In spite of their extragerminal center localization, IgE(+) cells showed signs of somatic hypermutation and affinity maturation. We demonstrated that high-affinity IgE(+) cells could be generated through a unique differentiation program that involved two phases: a pre-IgE phase in which somatic hypermutation and affinity maturation take place in IgG1(+) cells, and a post-IgE-switching phase in which IgE cells differentiate swiftly into plasma cells. Our results have implications for the understanding of IgE memory responses in allergy.


Figures
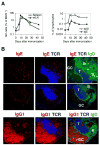
Figure 1
Figure 1. Switching to IgE occurs during the GC phase of an immune response, but IgE cells are found outside GC
T/B monoclonal mice were immunized with OVA-HA in alum by i.p. route. (A) Kinetics of appearance of GC (GL7+B220+) in spleen and mesenteric LN (mLN), and of IgE+ and IgG1+ cells in mLN (bars: StDev). The data was derived from FACS analysis of cells on days 6, 9, 12, 19, 27 and 43 after primary immunization, using the gates shown in Figure S1. (B) Immunohistochemistry showing tissue distribution of IgE+ and IgG1+ cells in sections of mLN at day 12 of immunization. Germinal centers (GC), T cell, and follicular B cell (B) areas are indicated. Original magnification 100X
Figure 2
Figure 2. Different localization of IgE+ and IgG1+ cells in lymph nodes of BALB/c mice infected with Nippostrongylus brasiliensis
Frozen sections of mesenteric LN from N.b.-infected BALB/c mice (day12) were analyzed by immunohistology. (A) Staining with antibodies to IgE, IgD, and TCRαβ reveals IgE+ cells in non-GC B cell areas and medullary region. (B) IgE cells are found in the margins and outside GL7+ GC areas. (C) IgG1 cells co-localize with GL7+ GC areas. Serial sections of the same LN are shown. (D) IgG1+ cells show predominantly membrane staining in GC, while IgE+ cells have bright cytoplasmic staining. A, B, C: original magnification 100X; D: 400X. Germinal centers (GC), T cell, Cortical (C), and Medullary (M) areas are indicated.
Figure 3
Figure 3. Class switching to IgE initiates in GC
(A) Schematic representation (not in scale) of the Ig heavy chain locus and the main ε transcripts, showing the localization of PCR primers used to amplify ε sterile, post-switched, and mature transcripts. Exons and introns in C regions not depicted. Top scheme: DNA configuration before switching; bottom schemes: DNA configuration after switching. The bracketed scheme on the left represents an alternative result of sequential switching (without γ1 remnants) as well as the result of direct μ to ε switching, (B) Distribution of ε sterile, switched, and mature transcripts in GC (B220+PNA+IgG1+ and B220+PNA+IgG1), non GC (B220+PNA) and plasma cell (Syndecan-1+) fractions from spleen of T/B monoclonal mice on day 12 of immunization. NI, B220+: purified B220+ cells from untreated T/B monoclonal mice. Expression was determined by quantitative real time PCR. Similar results were obtained when GC and non-GC B cells were sorted based on expression of FAS, B220 and IgG1 (not shown).
Figure 4
Figure 4. IgE+ cells differentiate swiftly into plasma cells. (A–B)
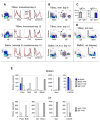
FACS analysis of mLN cells from OVA-HA-immunized T/B monoclonal mice and Nippostrongylus brasiliensis-infected BALB/c mice. LN cells were acid treated to remove cytophilic (extrinsic) antibodies and subsequently stained with antibodies to IgE, IgG1, B220 and either CD95 (FAS) or Syndecan-1. (A) Dot plots show IgE and IgG1 expression in cells from a live lymphocyte (FSC X SSC) gate. Overlay histograms show expression of B220, FAS and Syndecan-1 in gated IgE+ (red) or IgG1+ (black) cells. (B) Dot plots on the left show Syndecan-1 and B220 staining of cells from a lymphocyte gate. Plots on the right show IgG1 and IgE cells among gated Syndecan-1+ cells. (C) Real-time PCR analysis of mature IgE and IgG1 transcripts in IgE+ and IgG1+ sorted cells. (D) Dot plots of gated live lymphocytes from untreated T/B monoclonal and BALB/c mice. (E) IgE+ cells express genes of the plasma cell stage. IgE+FAS+ cells, IgG1+FAS+ cells and B220+FAS cells were sorted from spleen and mesenteric LN of T/B monoclonal mice 12 days after immunization with OVA-HA. Naïve B220+ cells (NI B220+) were purified from spleen of untreated T/B monoclonal mice. Gene expression analysis by real time PCR revealed that IgE+ cells express high levels of typical plasma cell genes such as Blimp 1 and Xbp1, and do not express Pax5, Bcl6, AID, or CXCR5.
Figure 5
Figure 5. B lymphocytes co-expressing surface IgG1 and IgE molecules display a plasma cell phenotype
T/B monoclonal mice carrying homozygous copies of the knockin V(D)J heavy and light immunoglobulin genes were immunized i.p. with OVA-HA in alum. (A) FACS analysis of LN cells 10 days after immunization indicates a population of IgG1+IgE+ dual-expressing cells. The dual- expressing cells displayed low levels of B220 and high levels of FAS and Syndecan-1. (B) IgG1+IgE+ double expressing cells from homozygous T/B monoclonal mice, and IgE+ and IgG1+ single expressing cells from heterozygous mice were purified by flow cytometry sorting 15 days after immunization. The expression of Pax5, Bcl6, AID, Blimp1, Xbp1, IgG1 and IgE was determined by real time PCR. Note the logarithmic scale for the Ig gene expression data, as the IgG1+IgE+ double-expressing cells have much higher levels of mature IgG1 transcripts than single IgG1+ cells, consistent with their plasma cell versus GC status, respectively.
Figure 6
Figure 6. Production of PEP1-specific IgG1 and IgE antibodies after repeated immunization with OVA-PEP1
(A) T/B monoclonal mice were repeatedly immunized with OVA-PEP1 in alum. Immunization days are indicated by vertical arrows. The serum levels of PEP1-specific IgG1 and IgE antibodies at the indicated time points were determined by ELISA. n= 5–6 mice per group. (B) Selection of CDR3 mutations in IgG1 and IgE antibodies of PEP1-immunized mice. Total RNA was extracted from spleen cells of T/B monoclonal mice 10 days after 2nd or 4th immunization with OVA-PEP1 (middle two columns), or OVA-HA, (two rightmost columns). IgG1 and IgE VDJ sequences from cDNA were amplified, cloned and sequenced. The numbers in the boxes represent the percentage of sequences coding for the indicated amino acid residue. The top residue in each box (i.e. R97, N100a, A101) is always the germline residue (Kabat numbering). We did not find positive selection of amino acid mutations in OVA-HA-immunized mice. (C) Analysis of nucleotide mutations in mice repeatedly immunized with OVA-PEP1 or OVA-HA. The figure shows the proportion of sequences of IgG1, IgE and IgG3 antibodies carrying the indicated numbers of nucleotide mutations per sequence (shown outside the pies). For each pie, the number of sequences analyzed is written in the centre. At least three mice per group and per time point were analyzed. The translated sequences were utilized for the analysis of amino-acid mutations shown in B.
Figure 7
Figure 7. Purified IgG1+ cells can generate high affinity IgE antibodies upon adoptive transfer
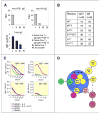
(A) B220+ IgD IgG1+ FAS+ and B220+ IgD IgG1 FAS+ cells were isolated from spleen and lymph nodes of T/B monoclonal mice 20 days after immunization with OVA-PEP1. The purified cells were transferred to TCRαβ−/− mice together with naïve OVA-specific T cells (IgG1+ cells: 8x10⁵ cells/mouse; IgG1 cells: 6x10⁵ cells/mouse; OVA-specific T cells: 5x10⁵ cells/mouse). The recipient mice, as well as a control groups receiving only T cells or no cells, were immunized with OVA-PEP1 one day after the transfer. Serum levels of PEP1-specific, HA-specific and total IgE were performed on day 13 after immunization. Individual mice were assayed for total IgE (shown average ± STD). HA and PEP1-specific IgE were assayed in IgG-depleted pooled samples. n=3 mice/group. (B) IgE antibodies derived from sequential switching show hypermutation and selection. B220+IgG1+ cells isolated from mice immunized twice with OVA-PEP1 were transferred together with naïve OVA-specific T cells into TCRαβ−/− recipients. The recipient mice were immunized twice with OVA-PEP1 and the sequences of IgG1 and IgE derived from the transferred B cells were analysed. VDJ genes derived from donor cells were identified by the knockin VDJ junctional sequence and JH3 usage. The numbers indicate the percentage of IgG1 or IgE sequences that carry the corresponding mutations. IgE molecules derived from the transferred IgG1+ cells carried positively selected T97-S100a-T101 mutations; however, IgE sequences had a lower frequency of the high affinity mutations than IgG1 sequences. (C) IL-21 inhibits sequential switching to IgE. IgG1+ cells and IgD+ cells were purified from spleen and LN of T/B monoclonal mice 10 days after i.p. immunization with OVA-HA. Cells were stimulated in vitro with anti-CD40 antibodies (aCD40), IL-4, and IL-21. The figure shows IgE and IgG1 antibody levels in culture supernatants (day 5). Purified IgD+ cells from non-immunized mice responded similarly to IgD+ cells from immunized mice. Proliferation was similar in IgD+ and IgG1+ cultures (data not shown). The data shown is representative of three experiments. (D) A model of the differentiation of IgE+ cells. B lymphocytes in the GC upregulate Bcl6, switch to IgG1 and undergo SHM and affinity maturation. Follicular helper T cells (Tfh) provide an IL-21 rich environment in the GC. Bcl6 expression and signalling through the IL-21R inhibit class switching to IgE in most GC cells. Class switching to IgE can occur in GC cells that down-regulate Bcl6 function, and interact with Th cells in a high IL-4 and low IL-21 microenvironment. Switching to IgE is linked to a pathway of exit from the GC and differentiation to plasma cell. CSR: class switch recombination; SHM: somatic hypermutation; AM: affinity maturation; PB: plasmablast; PC: plasma cell; MC: memory cell.

References

    1. Achatz G, Nitschke L, Lamers MC. Effect of transmembrane and cytoplasmic domains of IgE on the IgE response. Science. 1997;276:409–411. - PubMed
    1. Allen CD, Ansel KM, Low C, Lesley R, Tamamura H, Fujii N, Cyster JG. Germinal center dark and light zone organization is mediated by CXCR4 and CXCR5. Nat Immunol. 2004;5:943–952. - PubMed
    1. Coffman RL, Lebman DA, Rothman P. Mechanism and regulation of immunoglobulin isotype switching. Adv Immunol. 1993;54:229–270. - PubMed
    1. Curotto de Lafaille MA, Lino AC, Kutchukhidze N, Lafaille JJ. CD25- T cells generate CD25+Foxp3+ regulatory T cells by peripheral expansion. J Immunol. 2004;173:7259–7268. - PubMed
    1. Curotto de Lafaille MA, Muriglan S, Sunshine MJ, Lei Y, Kutchukhidze N, Furtado GC, Wensky AK, Olivares-Villagomez D, Lafaille JJ. Hyper immunoglobulin E response in mice with monoclonal populations of B and T lymphocytes. J Exp Med. 2001;194:1349–1359. - PMC - PubMed

Publication types