. 2007 Mar 8;169(2):162-76.
doi: 10.1016/j.toxlet.2007.01.006. Epub 2007 Jan 19.

Changes in gene expression profiles in response to selenium supplementation among individuals with arsenic-induced pre-malignant skin lesions

Affiliations

Changes in gene expression profiles in response to selenium supplementation among individuals with arsenic-induced pre-malignant skin lesions

Muhammad G Kibriya et al. Toxicol Lett. .

Abstract

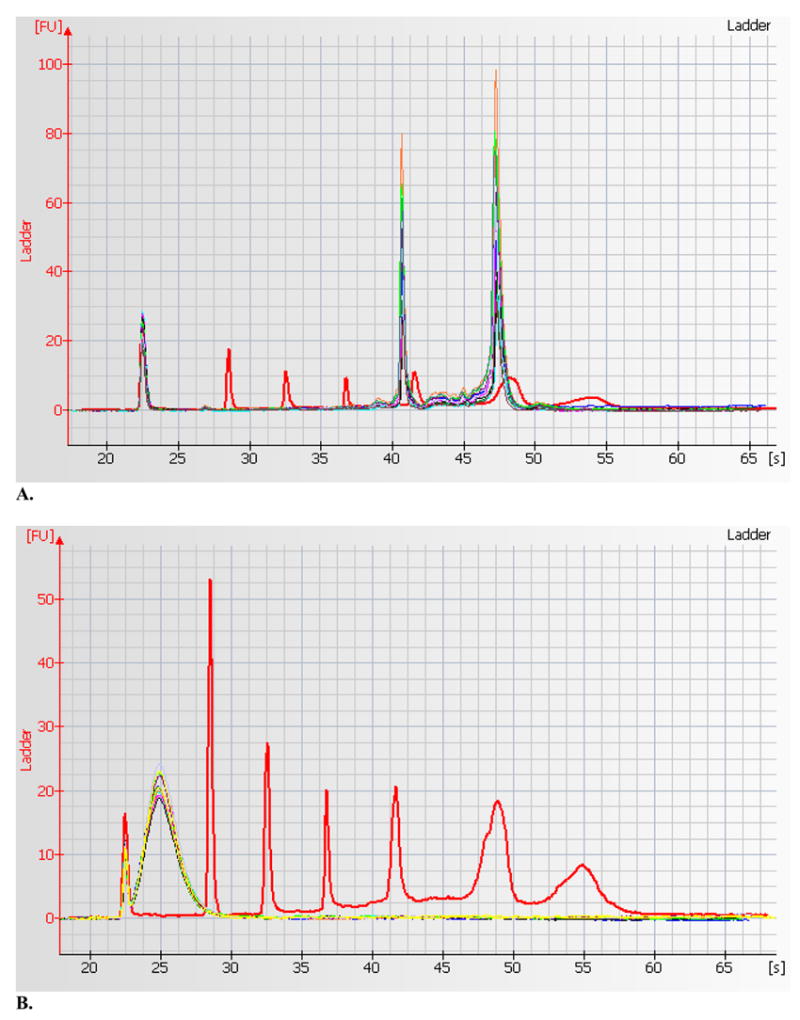
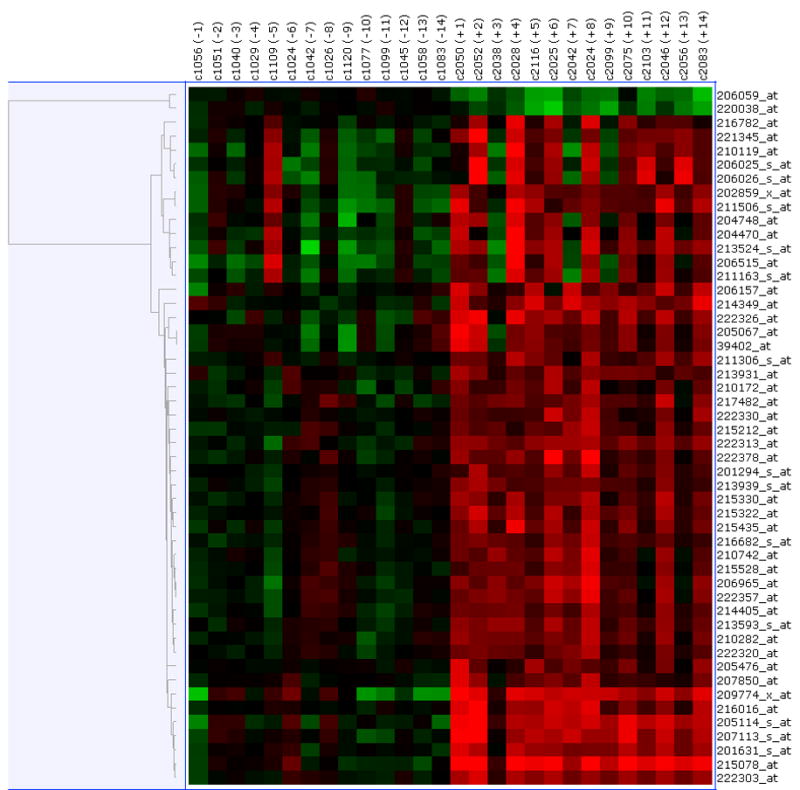
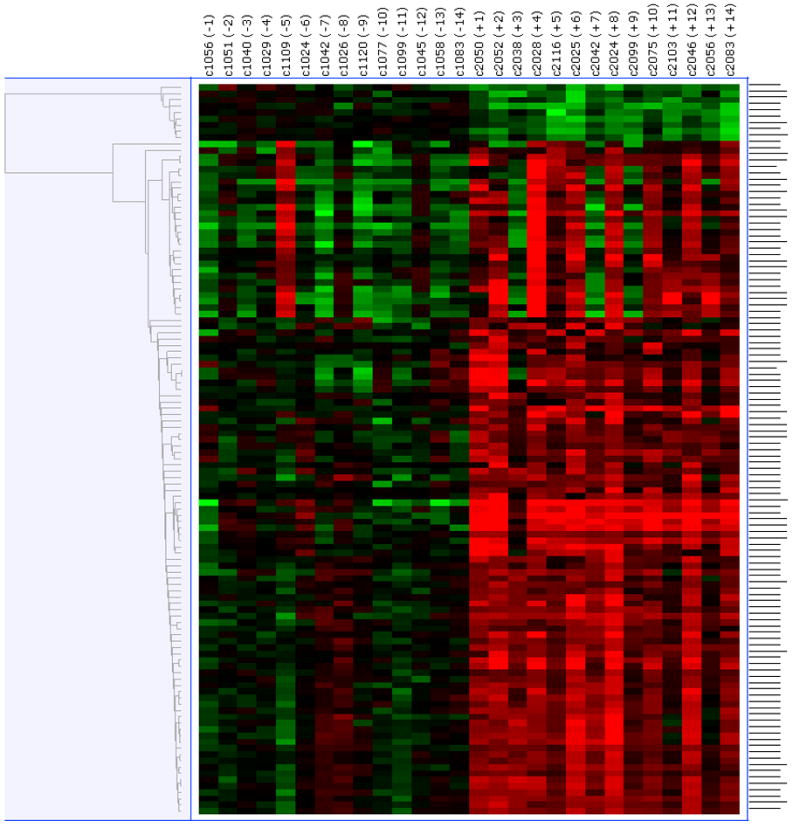
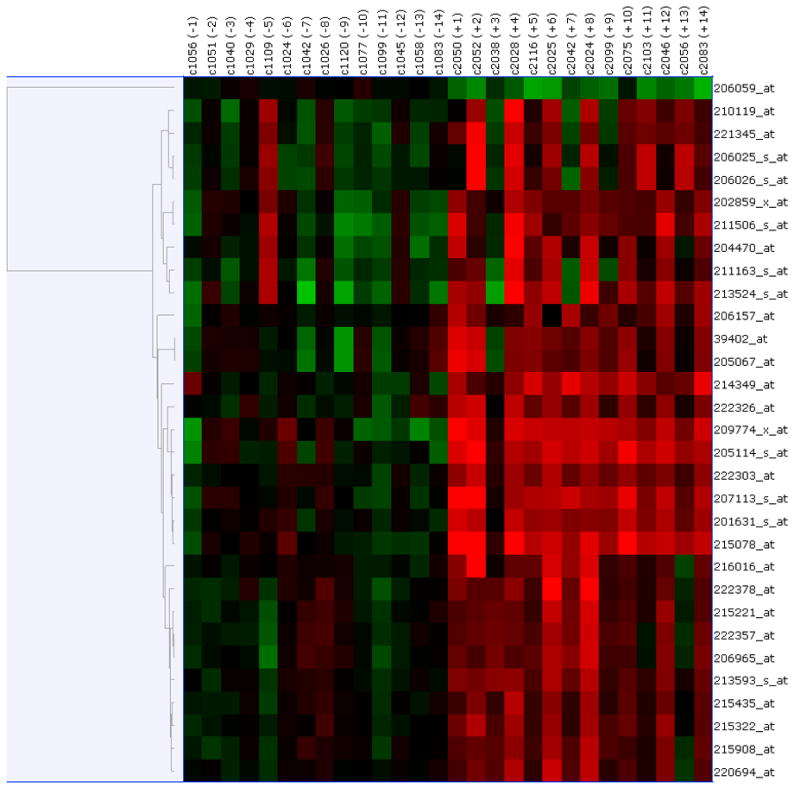
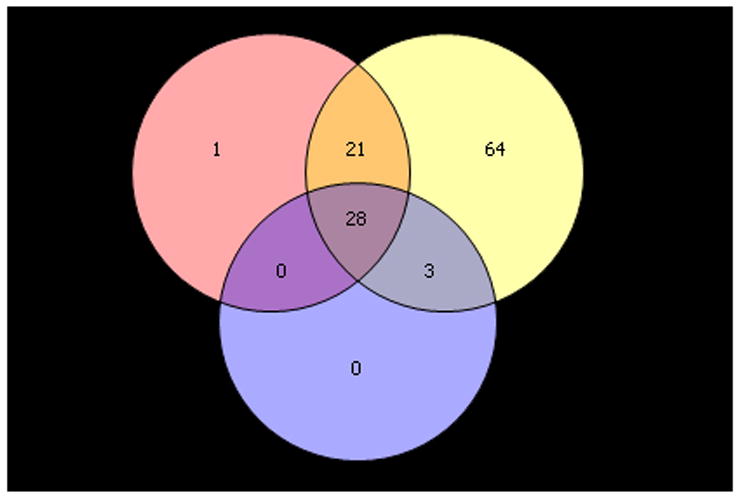
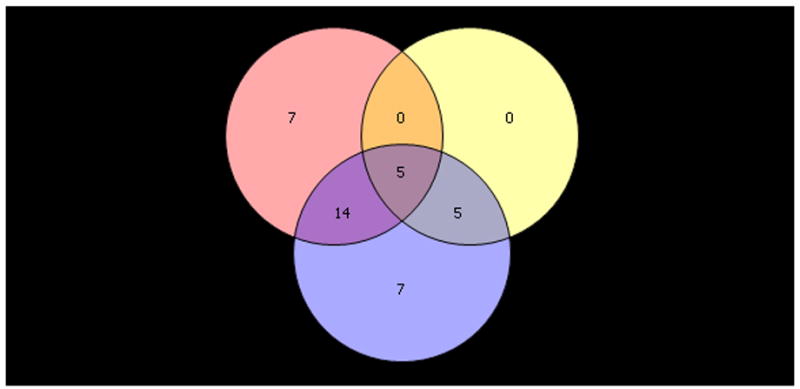
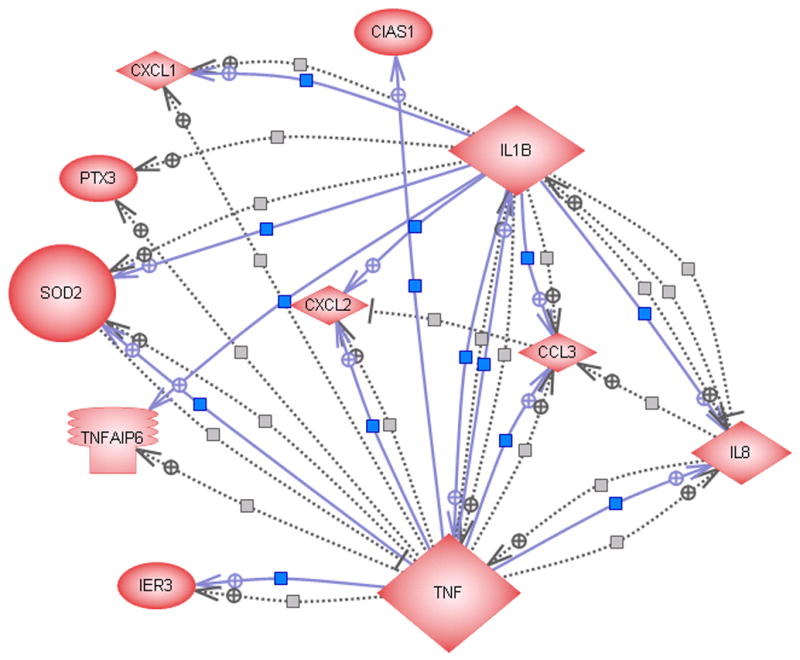
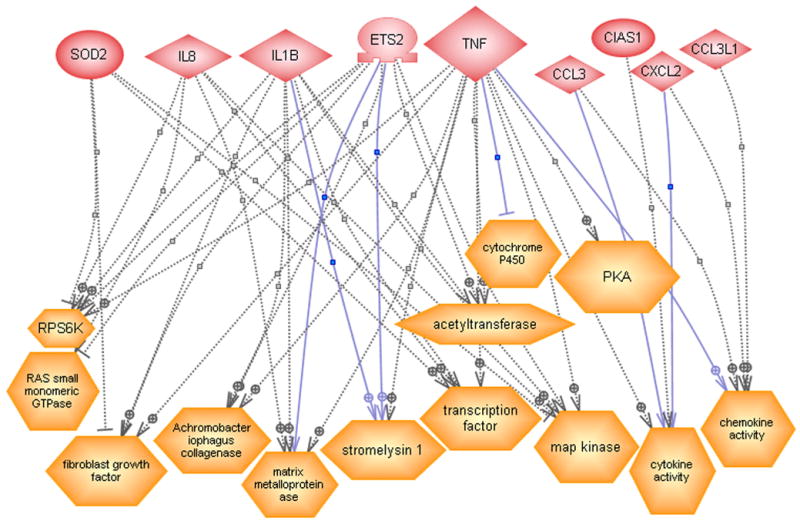
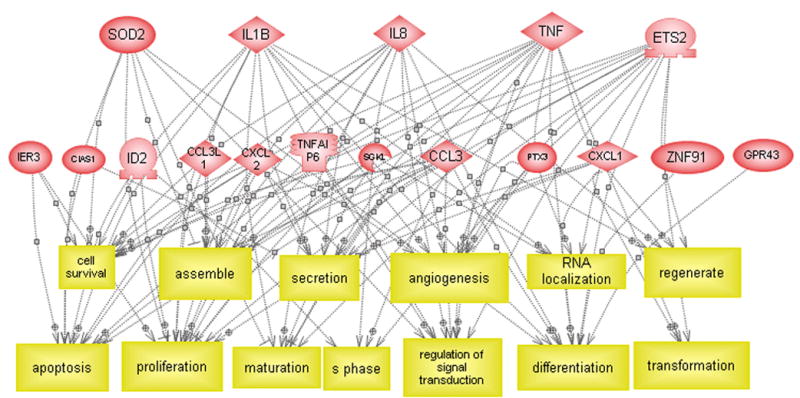
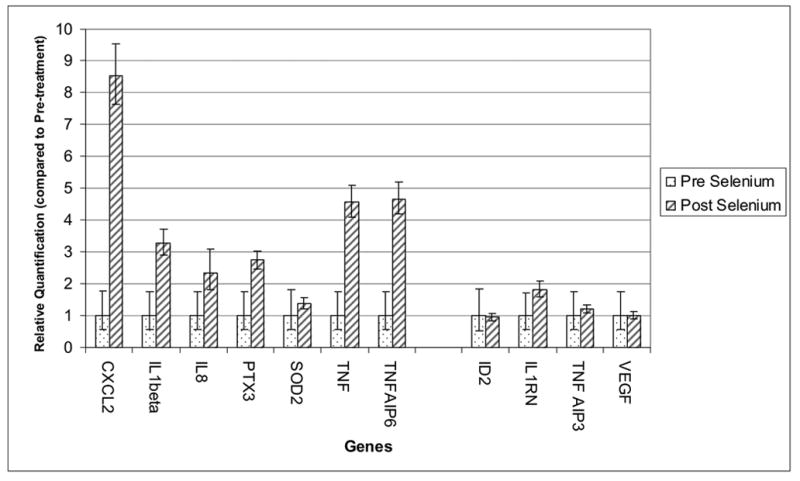
The molecular basis and downstream targets of oral selenium supplementation in individuals with elevated risk of cancer due to chronic exposure from environmental carcinogens has been largely unexplored. In this study, we investigated genome-wide differential gene expression in peripheral blood mononuclear cells (PBMC) from individuals with pre-malignant arsenic (As)-induced skin lesions before and after 6 months daily oral supplementation of 200 microg L-selenomethionine. The Affymetrix GeneChip Human 133A 2.0 array, containing probes for 22,277 gene transcripts, was used to assess gene expression. Three different normalization methods, RMA (robust multi-chip analysis), GC-RMA and PLIER (Probe logarithmic intensity error), were applied to explore differentially expressed genes. We identified a list of 28 biologically meaningful, significantly differentially expressed genes. Genes up-regulated by selenium supplementation included TNF, IL1B, IL8, SOD2, CXCL2 and several other immunological and oxidative stress-related genes. When mapped to a biological association network, many of the differentially expressed genes were found to regulate functional classes such as fibroblast growth factor, collagenase, matrix metalloproteinase and stromelysin-1, and thus, considered to affect cellular processes like apoptosis, proliferation and others. Many of the significantly up-regulated genes following selenium-supplementation were previously found by us to be down-regulated in a different set of individuals with As-induced skin lesions compared to those without. In conclusion, findings from this study may elucidate the biological effect of selenium supplementation in humans. Additionally, this study suggests that long-term selenium supplementation may revert some of the gene expression changes presumably induced by chronic As exposure in individuals with pre-malignant skin lesions.


Figures

Figure 1
Figure 1
(A) Agilent 2100 BioAnalyzer electropherogram of 10 RNA samples overlaid on ladder marker peaks (shown in red). After the initial spike, the ladder peaks correspond to 200 bp, 500 bp, 1000 bp, 2000 bp and 4000 bp respectively. The two distinct sharp peaks of RNA samples (in different colors other than red) represent the 18s (around 2000 bp ladder marker) and 28s (around 4000 bp ladder marker) and show evidence of high quality RNA. (B) Electropherogram of fragmented cRNA of 10 samples overlaid on same ladder marker peaks. This shows uniform and effective fragmentation of the labeled cRNA.
Figure 2
Figure 2
Upper panel shows heatmap comparing the gene expression in PBMC before and after six- month of selenium supplementation. Three different normalization methods shown – (A) RMA, (B) GC-RMA and (C) PLIER. In each heatmap panel, the left 14 columns represent pre-supplementation and right 14 columns represent post-supplementation expression and each row represents a gene/probe. The expression levels are shown in red (up-regulation) and green (down-regulation) compared to average baseline. Lower panel shows venn- diagram: (D) Venn diagram showing overlap of the lists of the differentially expressed genes analyzed by three different normalization methods – RMA, PLIER and GC-RMA. Upper left circle represents gene list from analysis using RMA normalized data, upper right circle represents GC-RMA and lower middle circle represents that of PLIER normalized data. (E) Venn diagram showing overlap of the lists of the differentially expressed genes analyzing the data of Gr-1 alone (upper left circle), Gr. 2 alone (upper right circle) and the combined data (lower middle circle) using PLIER normalization.
Figure 2
Figure 2
Upper panel shows heatmap comparing the gene expression in PBMC before and after six- month of selenium supplementation. Three different normalization methods shown – (A) RMA, (B) GC-RMA and (C) PLIER. In each heatmap panel, the left 14 columns represent pre-supplementation and right 14 columns represent post-supplementation expression and each row represents a gene/probe. The expression levels are shown in red (up-regulation) and green (down-regulation) compared to average baseline. Lower panel shows venn- diagram: (D) Venn diagram showing overlap of the lists of the differentially expressed genes analyzed by three different normalization methods – RMA, PLIER and GC-RMA. Upper left circle represents gene list from analysis using RMA normalized data, upper right circle represents GC-RMA and lower middle circle represents that of PLIER normalized data. (E) Venn diagram showing overlap of the lists of the differentially expressed genes analyzing the data of Gr-1 alone (upper left circle), Gr. 2 alone (upper right circle) and the combined data (lower middle circle) using PLIER normalization.
Figure 3
Figure 3
(A) Direct interactions between some of the differentially expressed genes. The solid and dashed lines indicate expression and regulatory functions respectively. (B) Regulatory effect of some of the differentially expressed genes on functional classes. (C) Regulatory effect of some of the differentially expressed genes on cell processes.
Figure 3
Figure 3
(A) Direct interactions between some of the differentially expressed genes. The solid and dashed lines indicate expression and regulatory functions respectively. (B) Regulatory effect of some of the differentially expressed genes on functional classes. (C) Regulatory effect of some of the differentially expressed genes on cell processes.
Figure 4
Figure 4
Relative quantification (RQ) of gene expression using Real-Time Quantitative PCR. X-axis shows the genes and Y-axis represents corresponding RQ of gene expression compared to pre-treatment stage, expression of which is set to 1. The vertical error bars represent 95% confidence intervals of the RQ values.

References

    1. Affymetrix. Affymetrix GeneChip Expression analysis technical manual. Santa Clara, CA: Affymetrix; 2001.
    1. Alain G, Tousignant J, Rozenfarb E. Chronic arsenic toxicity. Int J Dermatol. 1993;32(12):899–901. - PubMed
    1. Alvaro-Gracia JM, Zvaifler NJ, Firestein GS. Cytokines in chronic inflammatory arthritis. V. Mutual antagonism between interferon-gamma and tumor necrosis factor-alpha on HLA-DR expression, proliferation, collagenase production, and granulocyte macrophage colony-stimulating factor production by rheumatoid arthritis synoviocytes. J Clin Invest. 1990;86(6):1790–1798. - PMC - PubMed
    1. Amundson SA, Bittner M, Chen Y, Trent J, Meltzer P, Fornace AJ., Jr Fluorescent cDNA microarray hybridization reveals complexity and heterogeneity of cellular genotoxic stress responses. Oncogene. 1999;18(24):3666–3672. - PubMed
    1. Argos M, Kibriya MG, Parvez F, Jasmine F, Rakibuz-Zaman M, Ahsan H. Gene expression profiles in peripheral lymphocytes by arsenic exposure and skin lesion status in a Bangladeshi population [accepted for publication] Cancer Epidemiol Biomarkers Prev 2006 - PubMed

Publication types

MeSH terms