

Multiple association states between glycine receptors and gephyrin identified by SPT analysis
- PMID: 17293395
- PMCID: PMC1853151
- DOI: 10.1529/biophysj.106.095596
Multiple association states between glycine receptors and gephyrin identified by SPT analysis
Abstract
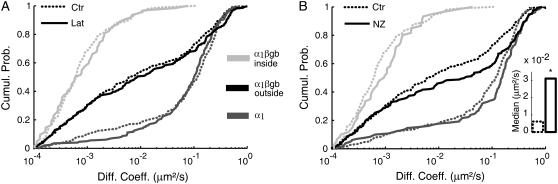
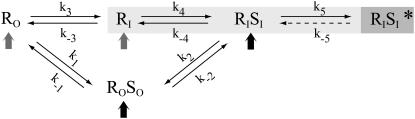
The scaffolding protein gephyrin is known to anchor glycine receptors (GlyR) at synapses and to participate in the dynamic equilibrium between synaptic and extrasynaptic GlyR in the neuronal membrane. Here we investigated the properties of this interaction in cells cotransfected with YFP-tagged gephyrin and GlyR subunits possessing an extracellular myc-tag. In HeLa cells and young neurons, single particle tracking was used to follow in real time individual GlyR, labeled with quantum dots, traveling into and out of gephyrin clusters. Analysis of the diffusion properties of two GlyR subunit types--able or unable to bind gephyrin--gave access to the association states of GlyR with its scaffolding protein. Our results indicated that an important portion of GlyR could be linked to a few molecules of gephyrin outside gephyrin clusters. This emphasizes the role of scaffolding proteins in the extrasynaptic membrane and supports the implication of gephyrin-gephyrin interactions in the stabilization of GlyR at synapses. The kinetic parameters controlling the equilibrium between GlyR inside and outside clusters were also characterized. Within clusters, we identified two subpopulations of GlyR with distinct degrees of stabilization between receptors and scaffolding proteins.
Figures


Similar articles
-
Fast and reversible trapping of surface glycine receptors by gephyrin.Nat Neurosci. 2001 Mar;4(3):253-60. doi: 10.1038/85099. Nat Neurosci. 2001. PMID: 11224541
-
Gephyrin oligomerization controls GlyR mobility and synaptic clustering.J Neurosci. 2009 Jun 17;29(24):7639-48. doi: 10.1523/JNEUROSCI.5711-08.2009. J Neurosci. 2009. PMID: 19535575 Free PMC article.
-
Intracellular association of glycine receptor with gephyrin increases its plasma membrane accumulation rate.J Neurosci. 2004 Feb 4;24(5):1119-28. doi: 10.1523/JNEUROSCI.4380-03.2004. J Neurosci. 2004. PMID: 14762130 Free PMC article.
-
Milestone Review: Unlocking the Proteomics of Glycine Receptor Complexes.J Neurochem. 2025 Apr;169(4):e70061. doi: 10.1111/jnc.70061. J Neurochem. 2025. PMID: 40285371 Free PMC article. Review.
-
Gephyrin: a key regulatory protein of inhibitory synapses and beyond.Histochem Cell Biol. 2018 Nov;150(5):489-508. doi: 10.1007/s00418-018-1725-2. Epub 2018 Sep 27. Histochem Cell Biol. 2018. PMID: 30264265 Review.
Cited by
-
Single particle tracking of alpha7 nicotinic AChR in hippocampal neurons reveals regulated confinement at glutamatergic and GABAergic perisynaptic sites.PLoS One. 2010 Jul 9;5(7):e11507. doi: 10.1371/journal.pone.0011507. PLoS One. 2010. PMID: 20634896 Free PMC article.
-
Heat shock cognate protein 70 regulates gephyrin clustering.J Neurosci. 2011 Jan 5;31(1):3-14. doi: 10.1523/JNEUROSCI.2533-10.2011. J Neurosci. 2011. PMID: 21209184 Free PMC article.
-
Light Sheet Illumination for 3D Single-Molecule Super-Resolution Imaging of Neuronal Synapses.Front Synaptic Neurosci. 2021 Nov 24;13:761530. doi: 10.3389/fnsyn.2021.761530. eCollection 2021. Front Synaptic Neurosci. 2021. PMID: 34899261 Free PMC article. Review.
-
Activity-Dependent Inhibitory Synapse Scaling Is Determined by Gephyrin Phosphorylation and Subsequent Regulation of GABAA Receptor Diffusion.eNeuro. 2018 Jan 18;5(1):ENEURO.0203-17.2017. doi: 10.1523/ENEURO.0203-17.2017. eCollection 2018 Jan-Feb. eNeuro. 2018. PMID: 29379879 Free PMC article.
-
Targeting the human serotonin transporter (hSERT) with quantum dots.Proc SPIE Int Soc Opt Eng. 2008 Feb 22;6866(68660X):nihpa155701. doi: 10.1117/12.782801. Proc SPIE Int Soc Opt Eng. 2008. PMID: 19936040 Free PMC article.
References
-
- Malinow, R., and R. C. Malenka. 2002. AMPA receptor trafficking and synaptic plasticity. Annu. Rev. Neurosci. 25:103–126. - PubMed
-
- Sheng, M., and M. J. Kim. 2002. Postsynaptic signaling and plasticity mechanisms. Science. 298:776–780. - PubMed
-
- Bredt, D. S., and R. A. Nicoll. 2003. AMPA receptor trafficking at excitatory synapses. Neuron. 40:361–379. - PubMed
-
- Triller, A., and D. Choquet. 2005. Surface trafficking of receptors between synaptic and extrasynaptic membranes: and yet they do move! Trends Neurosc. 28:133–139 (Review.). - PubMed
-
- Dahan, M., S. Levi, C. Luccardini, P. Rostaing, B. Riveau, and A. Triller. 2003. Diffusion dynamics of glycine receptors revealed by single-quantum dot tracking. Science. 302:442–445. - PubMed
Publication types
MeSH terms
Substances
LinkOut - more resources
Full Text Sources
